
Editors’ Highlights are summaries of recent papers by AGU’s journal editors.
Source: Geochemistry, Geophysics, Geosystems
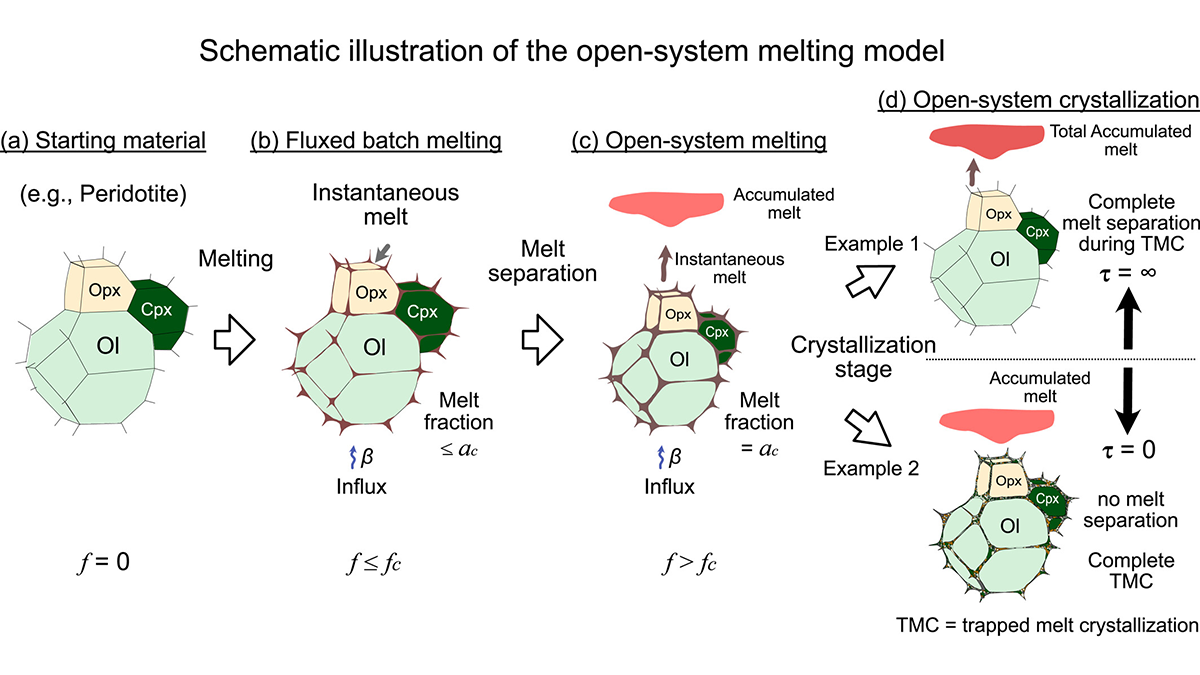
In the late 1980s, it became clear that partial melting of the mantle easily creates an interconnected network of melt-filled porosity that allows melt migration by porous flow at low degrees of melting. This overturned the batch melting paradigm that had previously governed thinking about mantle melting. Some of the clearest signatures and most important constraints on such “open-system” melting processes come from analyses of trace element concentrations in erupted basalts and residual mantle peridotites. A number of authors have since introduced analytical frameworks for exploring such trace element systematics, including the model of Ozawa [2001], which has had enduring success.
However, Ozawa’s model is complex to implement. The equations are challenging enough that a geochemist or petrologist contemplating applying the model to a new setting or data compilation faces a difficult programming task. Hence, the new and user-friendly graphical user interface (GUI) announced by Nishio et al. [2026] is a welcome advance. It allows novice users to apply the Ozawa model with confidence that the implementation is correct and to quickly visualize the consequences of various parameters, choices, and the quality of fit to their data.
As public databases of analytical results from globally distributed basalts and mantle rocks continue to grow, there are new opportunities for characterization of the range of melting environments that occur in Earth’s various tectonic settings. An easy-to-use tool for turning such raw data into meaningful constraints on processes beneath volcanoes should make it easier to realize such opportunities.
Citation: Nishio, I., Akizawa, N., Ozawa, K., Itano, K., & Waterton, P. (2026). A graphical user interface application to model open-system melting in the upper mantle. Geochemistry, Geophysics, Geosystems, 27, e2026GC013081. https://doi.org/10.1029/2026GC013081
—Paul Asimow, Editor, Geochemistry, Geophysics, Geosystems