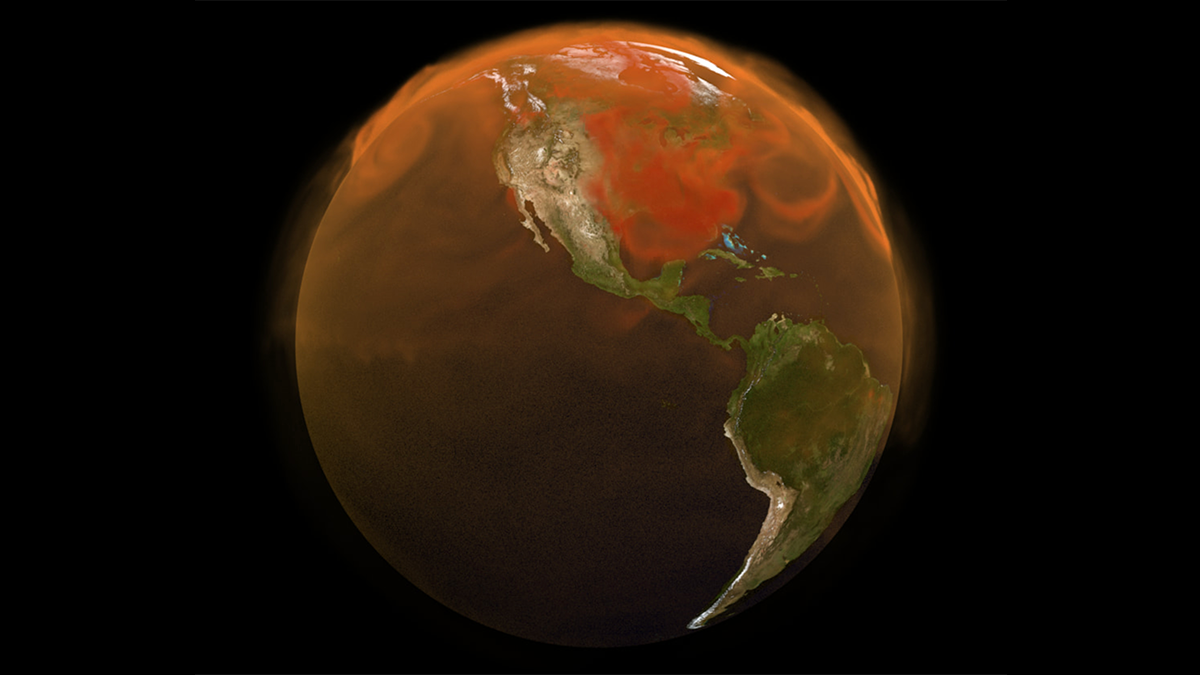
Source: Earth and Space Science
Every day, two NASA space instruments known as the Orbiting Carbon Observatory-2 and -3 (OCO-2 and OCO-3) capture more than a million observations of sunlight reflecting off Earth’s surface. Using the physics of how light travels through the air, an algorithm converts these raw data into atmospheric carbon dioxide (CO2) concentrations.
For more than a decade, these space-based CO2 measurements have helped to fill gaps in knowledge about Earth’s carbon cycle—how carbon moves between different reservoirs—on scales ranging from individual cities to the entire globe. Now, updates to the OCO-2 and OCO-3 data processing algorithms have enabled Taylor et al. to compile a new, improved record of global atmospheric CO2 levels that spans September 2014 to the present.
OCO-2 launched in 2014 as a free-flying satellite, and OCO-3 was installed on the International Space Station in 2019. Together their view from space has provided researchers with an unprecedented degree of global coverage, enabling many new discoveries about the carbon cycle and its response to events such as wildfires, droughts, and El Niño.
The new algorithm includes a variety of improvements, such as better instrument calibration and updates to how various factors—from clouds and aerosols to the way sunlight reflects off the ocean—are incorporated into the CO2 calculations.
After applying the new algorithm, the researchers found that compared with CO2 values estimated with the previous version of the algorithm, the new 2014–2026 record generally agrees more closely with highly accurate atmospheric CO2 measurements collected by a global network of ground-based instruments. OCO-2 and OCO-3 also agree closely with one another, an important cross-check between instruments that observe Earth from very different angles, times, and orbital paths.
In addition, the improved record can help scientists track how quickly CO2 accumulates in the atmosphere month by month rather than year by year, allowing near-real-time monitoring of how extreme events affect the carbon cycle.
The new record, now spanning more than a decade, is publicly available and can help researchers advance understanding of the carbon cycle and, in turn, assess the effectiveness of climate policies. (Earth and Space Science, https://doi.org/10.1029/2026EA005360, 2026)
—Sarah Stanley, Science Writer