
Thousands of ancient tombs dot the semiarid landscape of eastern Sudan.
Compared to their more famous cousins in Egypt, these tombs are neither well-known nor well studied because they lie off the beaten path. Just a single road leads to the city of Kassala, and an additional 5 hours of off-roading are required to get to the funerary sites, said Stefano Costanzo, a Ph.D. student in archaeology at the University of Naples “L’Orientale” in Italy.
But the journey is worth it.
“I didn’t know I was interested before seeing them. I didn’t even know they were there. But because I went and saw them, you know, [my] interest just shot up,” Costanzo said. Viewed from the field, “the place was stunning,” he said.
As described in a new study published in the open-access journal PLoS ONE, satellite images of these tombs revealed an even more intriguing observation: Not only were the funerary sites numerous; they were also clustered in groups of up to thousands of structures.
Clusters of Qubbas
The study is the first to apply a statistical method created for cosmology to the more grounded field of archaeology to quantitatively describe the immense number of tombs and how their locations were scattered across the landscape.
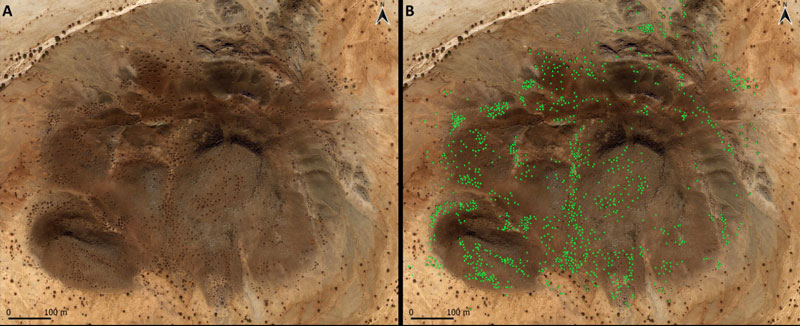
Using satellite imagery and information gathered in field surveys he did for 3 years prior, Costanza was able to map the locations of the funerary structures. It took 6 months to draw the map at a resolution high enough to permit statistical analysis.
“I literally drew single boulders sometimes,” said Costanzo, the lead author of the study.
The funeral structures in eastern Sudan came in two flavors: tumuli, which are simpler raised structures made of earth or stone, and qubbas, which are square shrines or tombs constructed with flat slabs of foliated metamorphic rock standing about 2 meters tall and 5 meters wide. Most of the site’s tumuli are dated to the first millennium CE, whereas the qubbas are associated with medieval Islam, built in the area starting from the 16th century up to the 20th.
In all, the data set contained 783 tumuli and 10,274 qubbas in the roughly 6,475-square-kilometer (2,500-square-mile) region.
Viewed from the sky, the qubbas were clustered along foothills or atop ridges. However, topography was not enough to completely explain where the qubbas were located—there seemed to be another force that drew them close to one another.
Neyman-Scott Cluster Process
Study coauthor Filippo Brandolini, an archaeologist and environmental scientist at Newcastle University in the United Kingdom, extensively reviewed different methods for analyzing spatial statistics before coming across the Neyman-Scott cluster process. First used to study the spatial pattern of galaxies, the process has since been used in ecology and biology research but never before in the field of archaeology.
“It’s actually refreshing to see people use some of these methods, even though they might not identify themselves as statisticians, in a pretty sound way.”
“It’s actually refreshing to see people use some of these methods, even though they might not identify themselves as statisticians, in a pretty sound way,” said Tilman Davies, a statistician at the University of Otago in New Zealand.
In fact, many statistical tools like the Neyman-Scott process were not originally created by statisticians, said Davies, who was not involved in the study. “They were sort of formulations that were derived by practitioners or applied scientists working in a particular field and thinking ‘This particular mathematical construction might be useful for my particular application.’”
In Sudan, the researchers found that many of the tombs were clustered around environmental features but also toward each other. Just as there’s a natural tendency for galaxies or stars to group together, there seems to be “a sort of gravitational attraction, which is actually social-cultural” for the patterns among the qubbas, possibly involving tribes or families, Costanzo said.
“They are attempting to describe the appearance of these points, both in terms of environmental predictors and in terms of some random mechanism that could explain this aggregation,” Davies said. “So they’re attempting to combine two things, which is often a very, very difficult thing to do.”
“We discovered the applicability of this tool; we didn’t invent it.”
Similar statistical tools and models may be a boon for archaeology as a whole.
Many locations are remote and hard to get to on the ground. Using satellite and remote sensing—in addition to methods that permit quantification—could allow for rigorous archaeology from the desk.
“We discovered the applicability of this tool; we didn’t invent it. But we found out that it is useful in archaeological terms,” Costanzo said. “It has the potential to help many other research expeditions in very remote lands.”
—Richard J. Sima (@richardsima), Science Writer
Citation:
Sima, R. J. (2021), Cosmological tool helps archaeologists map earthly tombs, Eos, 102, https://doi.org/10.1029/2021EO162076. Published on 18 August 2021.
Text © 2021. The authors. CC BY-NC-ND 3.0
Except where otherwise noted, images are subject to copyright. Any reuse without express permission from the copyright owner is prohibited.