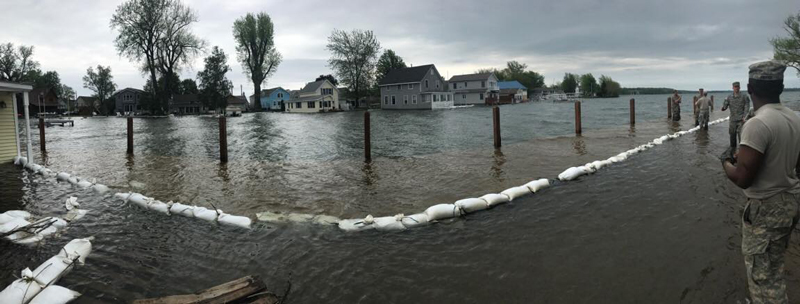
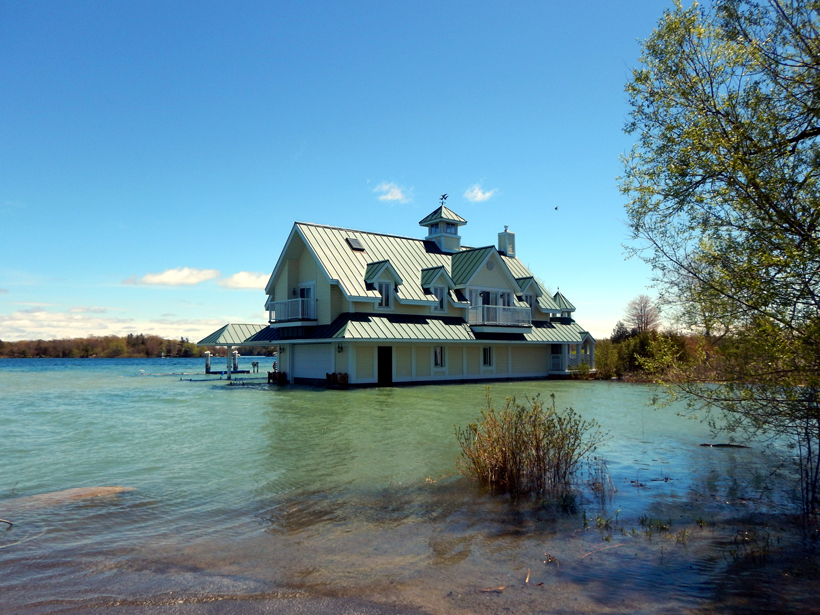
Since April, floodwaters along the shores of Lake Ontario have closed roads, inundated homes, and destroyed break walls. Shore-bound residents have watched the lake rise almost a meter above its normal levels, eroding away shorelines and threatening homes.
Lake Ontario stretches 310 kilometers, spanning the U.S. border with Canada between the state of New York and the province of Ontario. On both sides of the border, residents and politicians have called on managers of the Moses-Saunders Dam, which regulates water levels of Lake Ontario, to increase outflow from the lake into the Saint Lawrence River.
But it’s not that simple, say representatives of the International Joint Commission (IJC), a U.S.-Canadian organization that regulates bodies of water that cross or span the border.
Currently, 10,400 cubic meters of water rush out of the Moses-Saunders Dam every second. And that’s the highest rate the IJC will allow. The reason is that residents downstream along the Saint Lawrence River, all the way northeast to Montreal, are also fighting back floodwaters. Any more water coming from Lake Ontario could overwhelm them further.
What’s more, any added water would increase riverbank erosion, which reduces depths along the critical commercial navigation route of the Saint Lawrence Seaway. “Any further increase in outflow would jeopardize the safety of ships or halt commercial navigation,” according to IJC.
Tensions continue to rise with the lake waters, and in July, New York Governor Andrew Cuomo called on President Trump to replace IJC officials during a speech at a damaged harbor in Wilson, N.Y. New York State has already allotted $7 million to residents after homeowners’ insurance pays out, $10 million to repair public infrastructure, and $5 million in grants to small businesses. They’ve also deployed the New York Army National Guard to help set up temporary flood barriers and floating dams.

Governor Cuomo and others place blame on a new set of regulations for Lake Ontario called Plan 2014. The new regulations, finalized during the Obama administration, were approved by the IJC late last year. The plan was implemented in January—just months before waters started spilling into roads, neighborhoods, and homes.
Scientists and dam managers indicate that this flooding would have happened with or without Plan 2014. And the roots of the flooding may lie even further back, when everyone’s mind was on drought, not floods.
What Is Plan 2014, and Why Are People Blaming It?
Plan 2014 was designed by experts who manage the outflow of the Moses-Saunders Dam and study Lake Ontario and the Saint Lawrence River.
The plan includes new “triggers” for lowering or increasing water output during periods of extreme highs or lows, said Robert Caldwell, a technical adviser to the IJC’s International Lake Ontario-St. Lawrence River Board for the Canadian side. The board ultimately decides whether to increase or decrease outflow from Lake Ontario. The IJC says that most of the plan’s regulatory factors on lake levels, such as consideration of the time of year and current water levels, remain unchanged from previous criteria.
Specifically, the plan’s regulations aim to better mimic the “natural river” conditions that existed before the dam, in part to help restore wetlands surrounding the lake and river that have been damaged by a tighter range of water levels in the past, Caldwell explained. Because scientists and water resource managers want to stay as close to natural variations as possible, at some points, water levels might be a little higher or lower than residents along the Lake Ontario shoreline are used to. These changes, scientists suggest, will improve the biodiversity and overall health of the wetland in the long run, Caldwell said.
“The plan will also frequently extend the recreational boating season, better maintain system-wide levels for navigation and increase hydropower production,” the IJC said in a press statement.
Although politicians on both sides of the border blame Plan 2014 for the flooding damages affecting residents around Lake Ontario, Caldwell and other scientists have stressed that natural factors, not regulatory ones, are to blame for this year’s historic flooding. That’s because the plan went into effect only in January, and the series of events leading to the flooding has deeper roots.
So What Caused the Flooding?
After weeks of retrospective analysis, scientists at the National Oceanic and Atmospheric Administration (NOAA) released a new graphic describing what Caldwell called the “perfect storm” of different factors that led to this year’s flooding.
First, it’s important to understand the geography of the region. Lakes Superior, Huron, Michigan, Erie, and Ontario, some of the largest freshwater lakes on Earth, are intimately connected. They span the U.S.-Canadian border across Minnesota, Wisconsin, and Michigan and even bump up against Ohio, a corner of Pennsylvania, and New York, not to mention the Canadian province Ontario. Water from westernmost Lake Superior flows east into Lake Huron, where it passes back and forth to and from Lake Michigan. From there, the water flows into Lake Erie and then flows north via the 60-kilometer-long Niagara River into Lake Ontario. From Lake Ontario, water flows northeast out through the Saint Lawrence River, past Montreal, and out to the Atlantic Ocean.
This interconnectedness makes the lakes “like one massive river system,” said Andrew Gronewold, a hydrologist in NOAA’s Great Lakes Environmental Research Laboratory.
Lake Ontario receives water from precipitation, runoff from the surrounding basin, and water from the Niagara River. This spring, all three sources dumped more water than normal into the lake.
From January to June 2017, the Niagara River swelled to higher than average levels, Gronewold said. These weren’t necessarily record-breaking levels, but a sustained period of more water than usual. In fact, the Niagara River added almost a half a meter—relative to historical averages—to Lake Ontario.
April and May hammered the Lake Ontario basin with record-breaking precipitation.
For the first few months of 2017, meanwhile, the lake’s other water sources hovered around average. Between January and March, precipitation onto the lake and runoff from sources outside the Niagara watershed remained within historical norms.
Then April hit. This “is where it gets really amazing,” Gronewold said.
April and May hammered the Lake Ontario basin with record-breaking precipitation, including rain and snow, adding about three quarters of a meter to Lake Ontario through precipitation directly onto the surface as well as runoff from the rest of the basin.
This overload of water means that “it doesn’t really matter which regulation plan you’re dealing with,” Caldwell said. Unlike with the Oroville Dam flood earlier this year in California, there’s no water management decision to point fingers at. For Lake Ontario, given the overwhelming influx of water on top of an already higher than usual supply from the Niagara River, the flooding was inevitable, Caldwell explained.
A Story 3 Years in the Making
Because the Great Lakes are connected, current water levels in Lakes Superior, Michigan, and Huron—which rose to record highs 3 years ago—may have set the stage for this year’s flooding, Gronewold said.
Between January 2013 and December 2015, those lakes experienced the most rapid rise in water level ever recorded. As a result of high precipitation, Lake Superior rose 0.6 meter during that time, whereas Lakes Michigan and Huron—which hydrologists think of as one vast body of water—rose 1 meter.
The flooding of Lake Ontario thus was a story 3 years in the making, Gronewold explained.
But if these upper lakes are directly related to Lake Erie, the Niagara River, and Lake Ontario and onward, why didn’t scientists foresee the flooding?
The answer to this question requires a trip deeper into the past. Between the late 1990s and 2013, the Great Lakes experienced sustained record low water levels, Gronewold said. At that point, “people were not thinking about flooding,” they were concerned about rising air temperatures, evaporation, and “water slipping away from the system.”
Although researchers know that the Great Lakes can experience extreme highs and lows, a narrative of chronic drought took over during this drawn-out period of low water levels, said Richard Rood, a climatologist at the University of Michigan’s Great Lakes Integrated Sciences and Assessments Program. “A lot of the anticipation has been that lake levels due to climate change will be declining,” he said. Once the idea of sustained drought “got out there,” Rood continued, “it started getting echoed from one group to the next.”
“An unexpected surge in precipitation and runoff, an unexpected water rise was not on the radar,” Gronewold said. In other words, no one was anticipating that severe low water conditions could switch to flood conditions so rapidly, so water managers had little time to adjust.
When Will Flood Conditions End?
Most shoreline protection structures were built to standards set by the IJC back in 1958, Caldwell noted. “We now expect levels to fall below this (albeit arguably arbitrary) ‘flood’ threshold sometime between the middle and end of August,” he wrote in an email.
But flooding is a subjective term; for example, parks on Lake Ontario’s Toronto Islands reopened earlier this week after being closed for nearly 3 months, Caldwell added. “So they would certainly consider ‘flooding’ to have already ended.”
On a conference call on 1 August, the IJC agreed to lower Lake Ontario’s outflow from 10,400 to 9,910 cubic meters per second at midnight on 8 August. “Of course, this is still an extremely high flow, and people can readily expect high flows to continue for some time to come (likely into ice formation season),” Caldwell explained.
Climate Change Takeaways
Can climate change explain the current flooding? How will climate change affect the Great Lakes in the future? It’s complicated, Gronewold explained. The latter’s answer is “not a story of persistent water level rise like the marine coast, and it’s not a story of persistent water level decline like some arid regions,” Gronewold said.
“We went from record lows over a 100-year [period] to a record high in just 5 years.”
Instead, it’s likely a push-pull between “chronic air temperature rise,” which draws water from the lakes, on the one hand, and increased precipitation on the other hand, Gronewold said. Thus, the past few years may be a window into the future of more extreme variation.
“We went from record lows over a 100-year [period] to a record high in just 5 years,” Gronewold said. In other words, extremes may become more common. How then can we make informed decisions to manage the lakeshore where thousands of people live and work?
Historical records may provide much needed insight, Gronewold suggests. Even without a changing climate, the Great Lakes region is variable, according to records that stretch back to the 1860s. Rapid increases and decreases are not necessarily out of the question. Gronewold hopes that in the future, policy makers and community managers will take that into account when deciding where to build roads, buildings, and other infrastructure and when communicating hazards and risks to those living near the shore.
And they’ll need to, Rood said. “We are going to continue to see these episodes of large record-high precipitation,” he noted. “The world is probably going to be a little bit less steady going forward.”
—JoAnna Wendel (@JoAnnaScience), Staff Writer
Citation:
Wendel, J. (2017), What caused the ongoing flooding on Lake Ontario?, Eos, 98, https://doi.org/10.1029/2017EO079079. Published on 03 August 2017.
Text © 2017. The authors. CC BY-NC-ND 3.0
Except where otherwise noted, images are subject to copyright. Any reuse without express permission from the copyright owner is prohibited.


