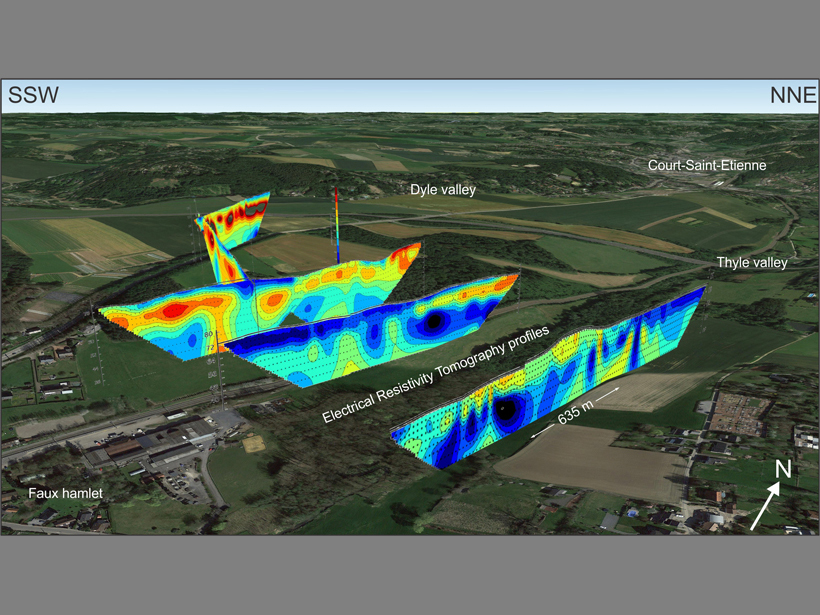
Combining the capabilities of an open-source drawing tool with Google Earth maps allows researchers to visualize real-world cross-sectional data in three dimensions.
MOST SHARED
Geophysical Research Letters
“Climate Change Drives Widespread and Rapid Thermokarst Development in Very Cold Permafrost in the Canadian High Arctic”
By Louise M. Farquharson et al.
HIGHLY CITED
Radio Science
“Vegetation modeled as a water cloud”
By E. P. W. Attema, Fawwaz T. Ulaby
HOT ARTICLE
Geophysical Research Letters
“Numerical Simulation of Atmospheric Lamb Waves Generated by the 2022 Hunga-Tonga Volcanic Eruption”
By Angel Amores et al.