
Turbidity currents move suspended sediment into the ocean. In general, the more sediment, the stronger the turbidity current, but one process may generate turbidity currents from very dilute rivers.
Editors’ Highlights
Posted inEditors' Highlights
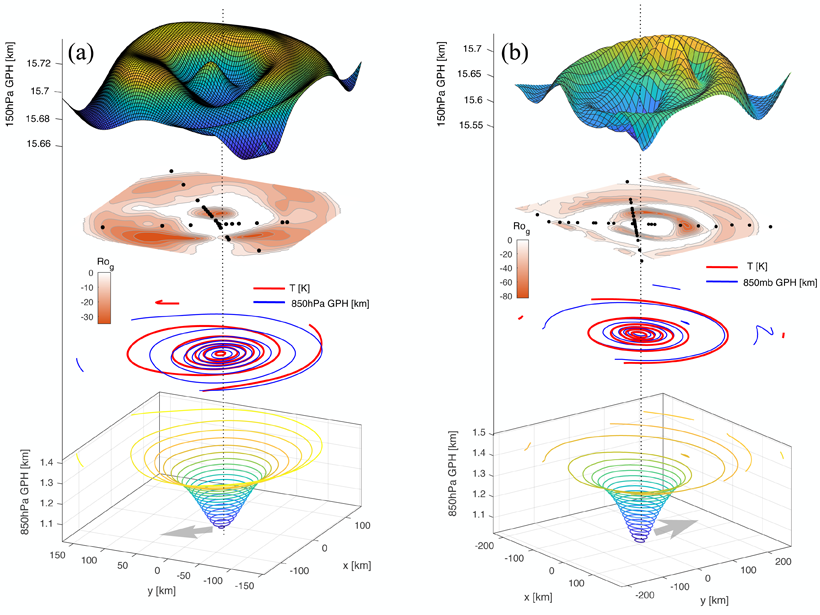
Examining the Structure of Tropical Cyclones’ Upper Levels
Unique observations used to examine the structure and mass balance of hurricanes’ top levels find that regions of high pressure violate the gradient wind balance.
Posted inEditors' Highlights
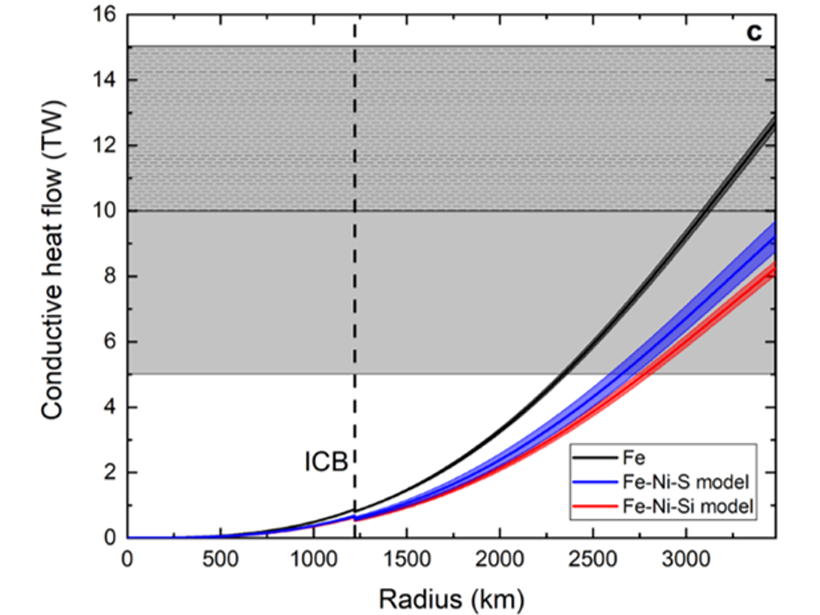
Thermal Convection Can Power the Geodynamo
New high-pressure experiments on fluid iron suggest thermal convection without compositional buoyancy is sufficient to drive the dynamo generating Earth’s magnetic field.

Posted inEditors' Highlights
Machine Learning Improves Satellite Rainfall Estimates
A new deep learning approach bridges ground rain gauge and radar data with spaceborne radar observations of Tropical Rainfall Measuring Mission to improve precipitation estimation.

Posted inEditors' Highlights
Future Remote Sensing Mission Holds Promise for Flood Monitoring
The 2021 Surface Water and Ocean Topography (SWOT) mission will measure water surface elevation, slopes, and inundations of rivers as narrow as 50 meters.

Posted inEditors' Highlights
Permafrost Thaws Rapidly as Arctic River Flooding Increases
As climate warms, Arctic rivers carry higher flows and flood earlier in the spring, causing underlying permafrost to thaw rapidly.

Posted inEditors' Highlights
CAT Pictures of Internal Solitary Waves in Indonesian Strait
Huge and rapid subsurface temperature changes associated with propagating internal solitary waves were observed from a moored coastal acoustic tomography (CAT) system in Lombok Strait in Indonesia.

Posted inEditors' Highlights
Seafood Farming: A Key to Future Global Food Security
Integration of sustainable marine and freshwater aquaculture with terrestrial agriculture will be necessary for meeting Earth’s future food requirements.
![Figure 4 from paper by Preuss et al. [2019]](https://eos.org/wp-content/uploads/2019/09/2019JB017324-Figure-4-sized.png)
Posted inEditors' Highlights
Can We Tell If Faults Grew During or Between Earthquakes?
Numerical simulations of earthquake cycle deformation reveal that co-seismic and interseismic fault propagation can produce distinct propagation angles that may be recorded in the crust.

Posted inEditors' Highlights
A Thermochemical Recording Mechanism of Earth’s Magnetic Field
A laboratory study assesses thermochemical remanence as a reliable paleointensity recorder, which could open new venues for studying Earth’s ancient magnetic field.