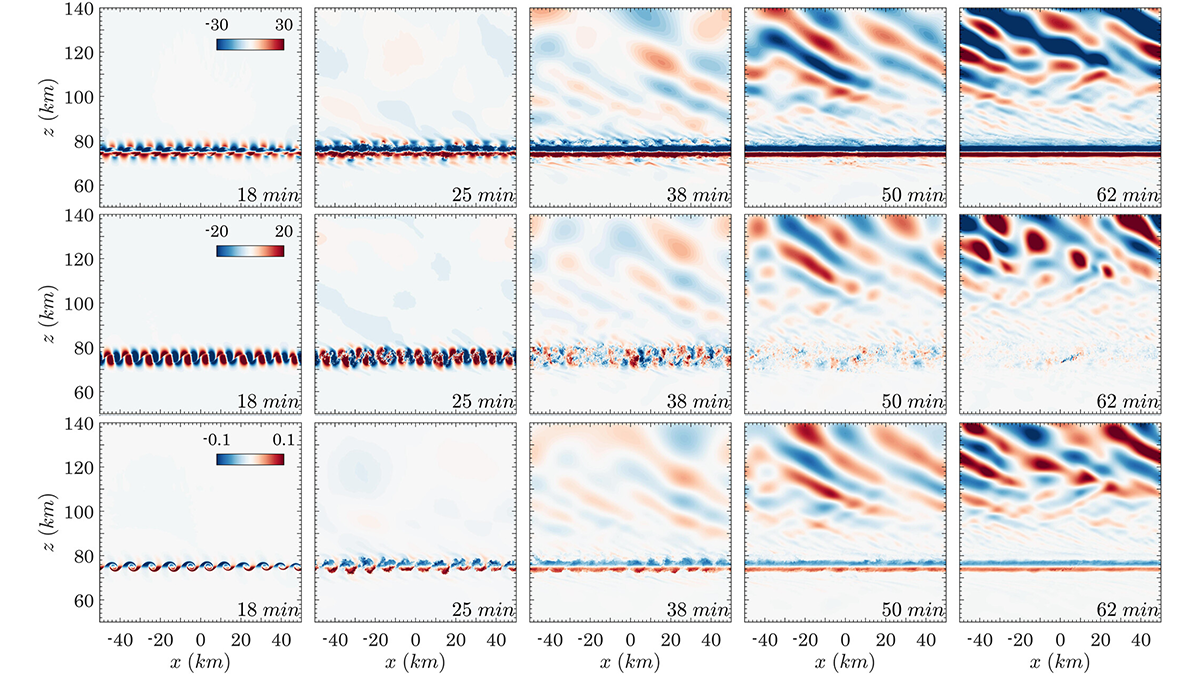
A new study shows that atmospheric gravity waves can be generated by the Kelvin-Helmholtz instabilities in the wind shear layer.
Editors’ Highlights
Posted inEditors' Highlights, RTL
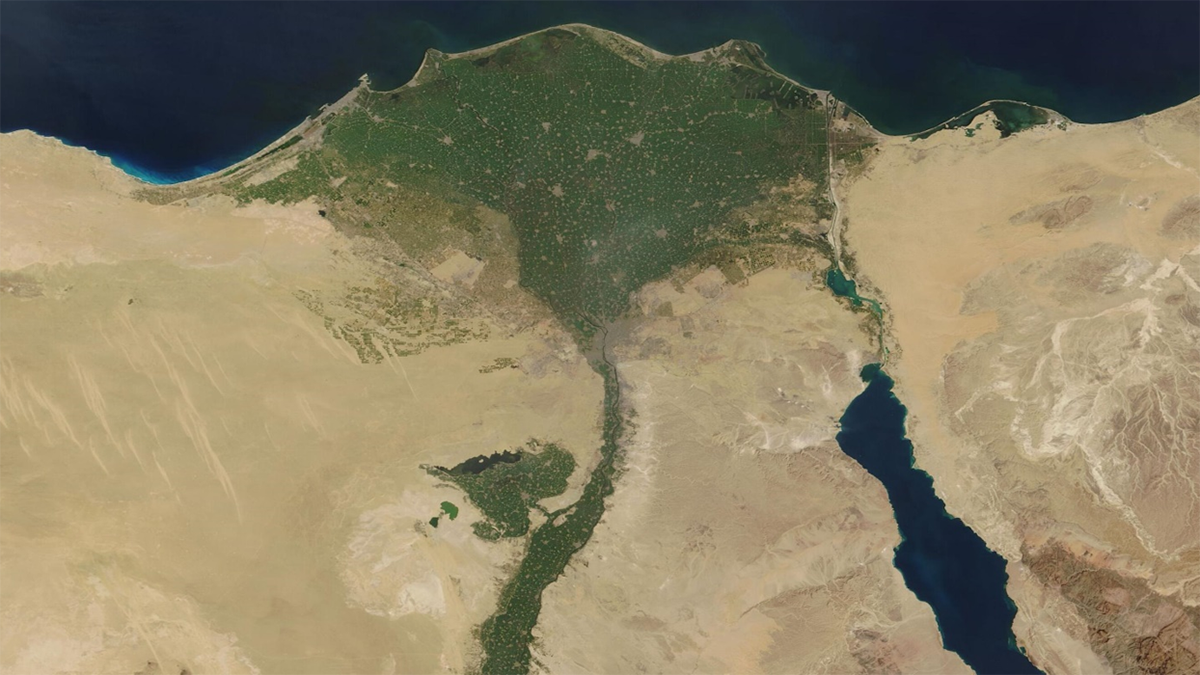
مراقبة تراكم الملوثات من المعادن الثقيلة في دلتا النيل
تُظهر نتائج تحاليل العينات أن إعادة استخدام مياه الصرف بدون معالجة والتوسع في إنشاء السدود يسبب زيادة تركيز المعادن الثقيلة الملوثة في دلتا النيل مما يهدد بشدة سلامة النظام البيئي والصحي والإنتاج الزراعي في مصر.

Posted inEditors' Highlights
Zooming in on the Nucleus of Earthquake Fault Slips
Controlled arrest and re-nucleation of laboratory earthquakes reveals nucleation processes unapproachable by traditional linear elastic fracture mechanics.
Posted inEditors' Highlights
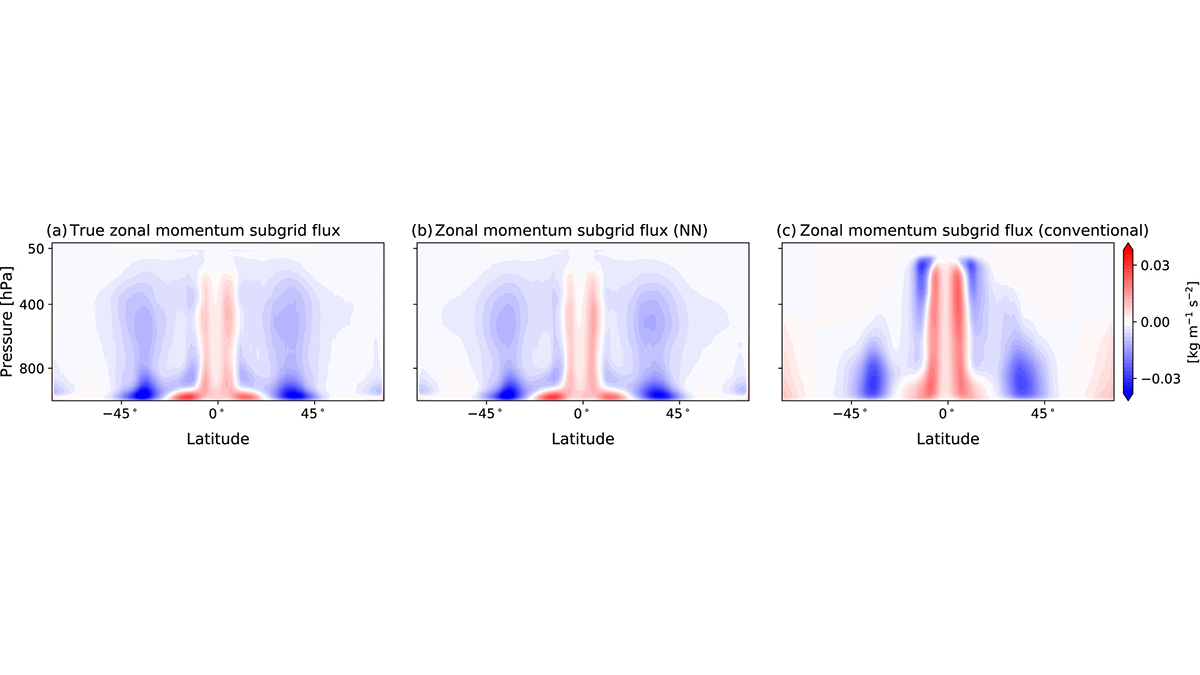
New Machine Learning Parameterization Tested on Atmospheric Model
For the first time, a neural network parameterization of subgrid momentum transport is developed by training on a coarse-grained high-resolution atmospheric simulation.
Posted inEditors' Highlights
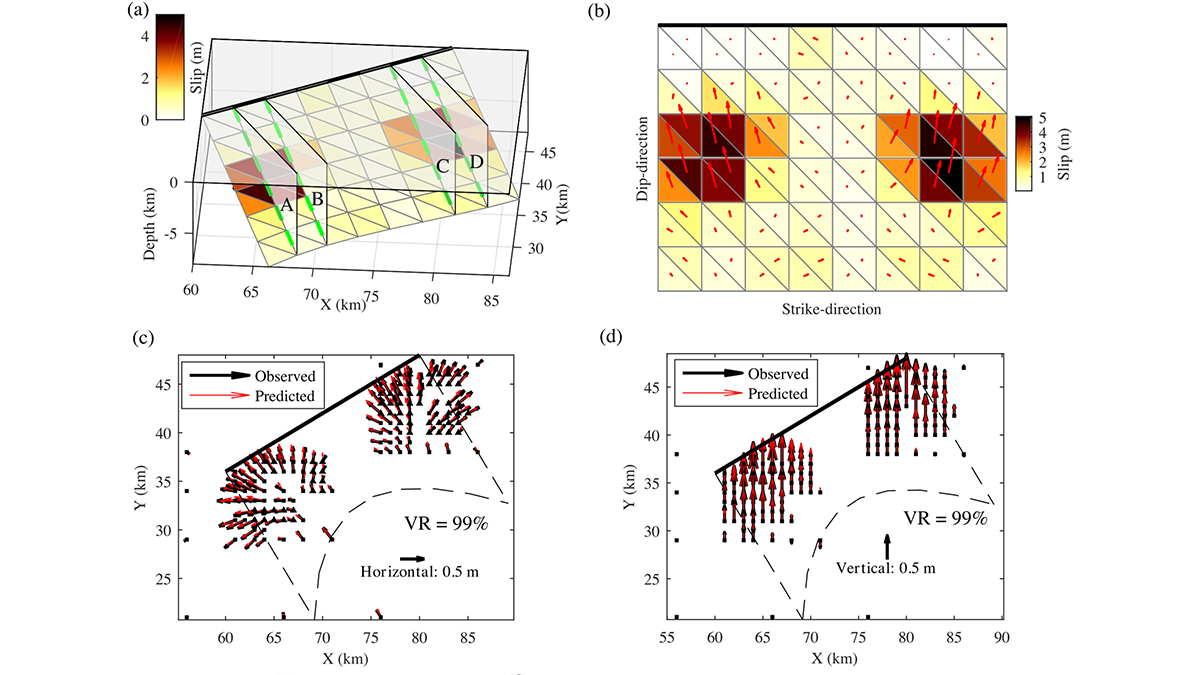
Bayesian Inversion Used to Recover Geometry of Ruptured Fault
A new Bayesian inversion framework is used to solve non-planar geometry of a ruptured fault from spatially variable slip and rake measured with geodesy.
Posted inEditors' Highlights
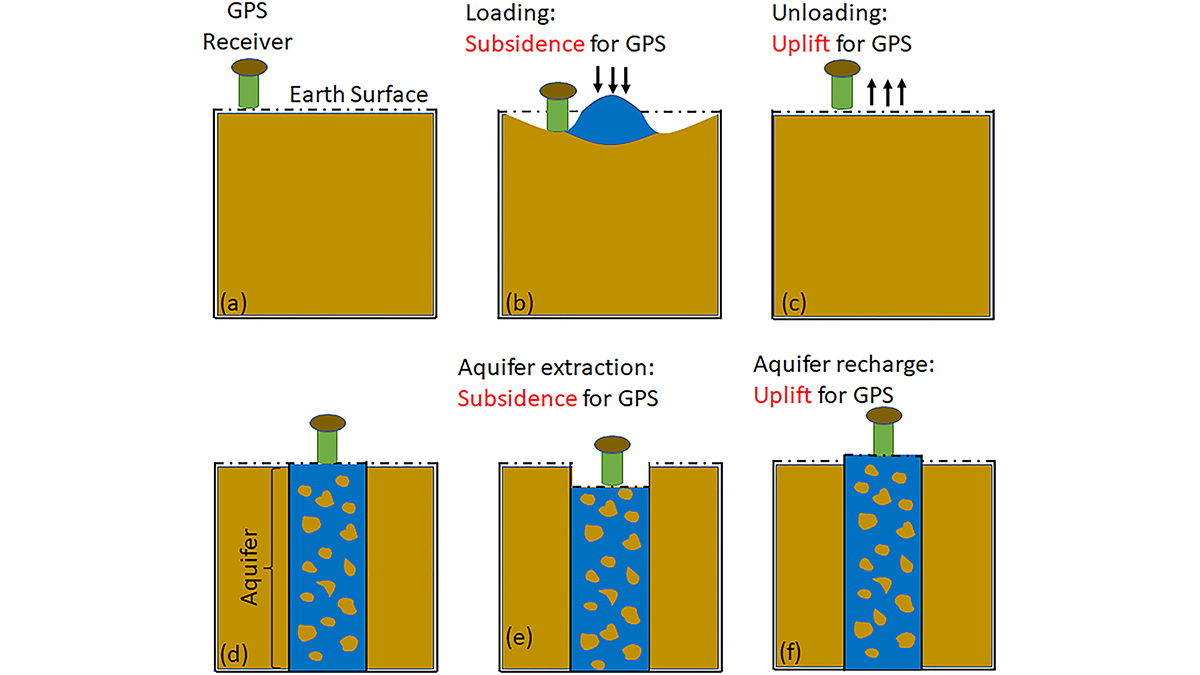
GPS Observations Sense Groundwater Change in Australia
By exploiting the fact that changes in groundwater cause deformations of the Earth’s surface, GPS receivers are used to detect groundwater changes related to extreme events and to seasonal oscillations.

Posted inEditors' Highlights
Collaboration Helps Overcome Challenges in Air Quality Monitoring
Everything looks ideal for collaboration: interest from community members, a new method for monitoring air quality by scientists, and interest from policymakers. What happens next?
Posted inEditors' Highlights
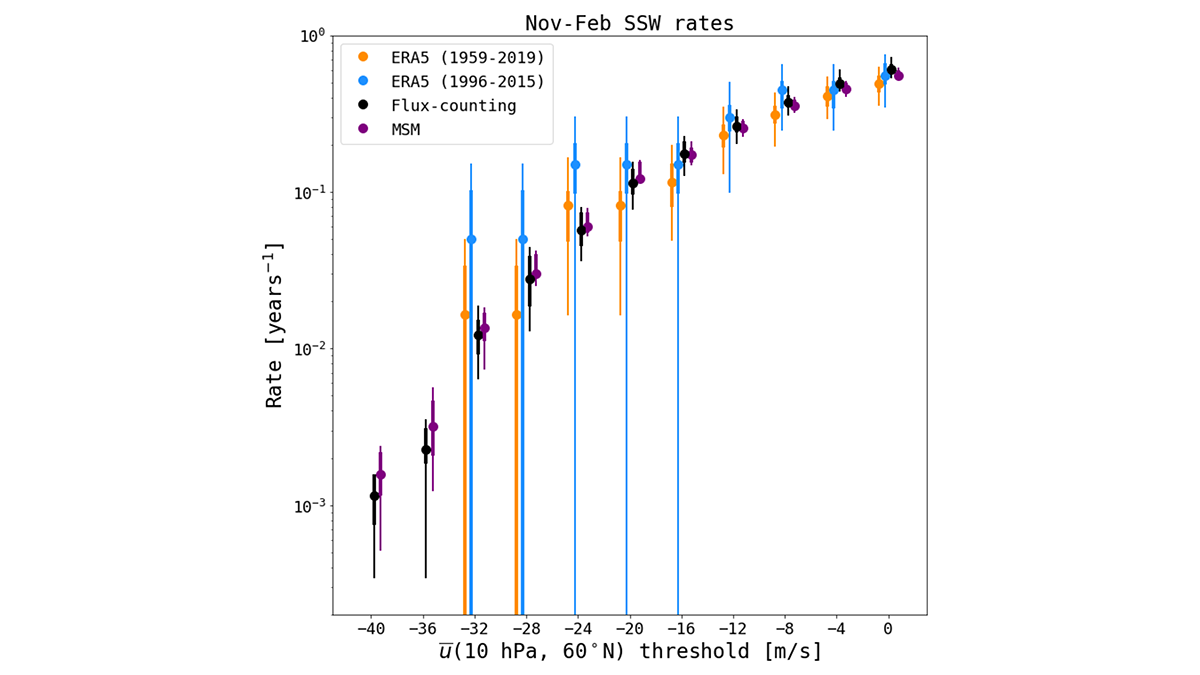
Quantifying Extreme Events from Short Weather Forecast Data
Subseasonal weather forecast ensembles are a useful tool for overcoming the inherent difficulty of quantifying extreme weather risk caused by data scarcity.
Posted inEditors' Highlights
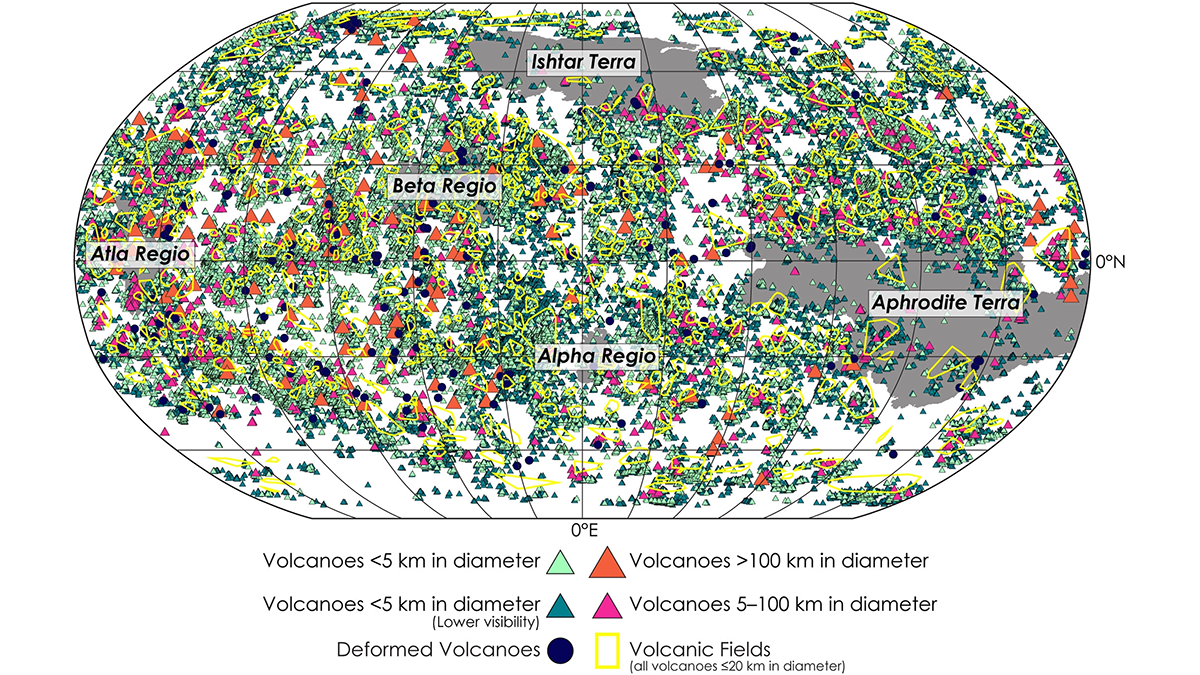
A New View of Volcanism on Venus
Researchers present the most comprehensive catalog of Venusian volcanic edifices to date, providing new knowledge of the geological evolution of a relatively understudied planet.

Posted inEditors' Highlights
Analyzing Sources of Pollution in the Great Lakes
Understanding how agriculture and land use affect nutrient flows and concentrations in the vast area of the Great Lakes is an essential step to developing sustainable management strategies.