Source: GeoHealth
Lead is a neurotoxin that can damage multiple body systems and lead to learning and developmental problems. The element has been phased out of use in paint, gasoline, and other industrial applications for decades, but it can persist for years in the soil. Children, who can be particularly vulnerable to lead poisoning, can accidentally ingest and inhale lead particles when they play in contaminated areas.
Even though one in four U.S. homes likely has soil lead levels over the recommended safety limits, no major U.S. city includes systematic soil monitoring as part of its lead prevention services, and blood testing often happens only after exposure.
Chicago is one city with many homes built before 1978—the year the U.S. government banned the use of lead-based paint—and its industrial history means that many residents could be living with elevated blood lead levels (EBLL) because of the prevalence of lead in the surrounding soil. Testing soil for lead is one way to predict which communities are most at risk for childhood lead exposure.
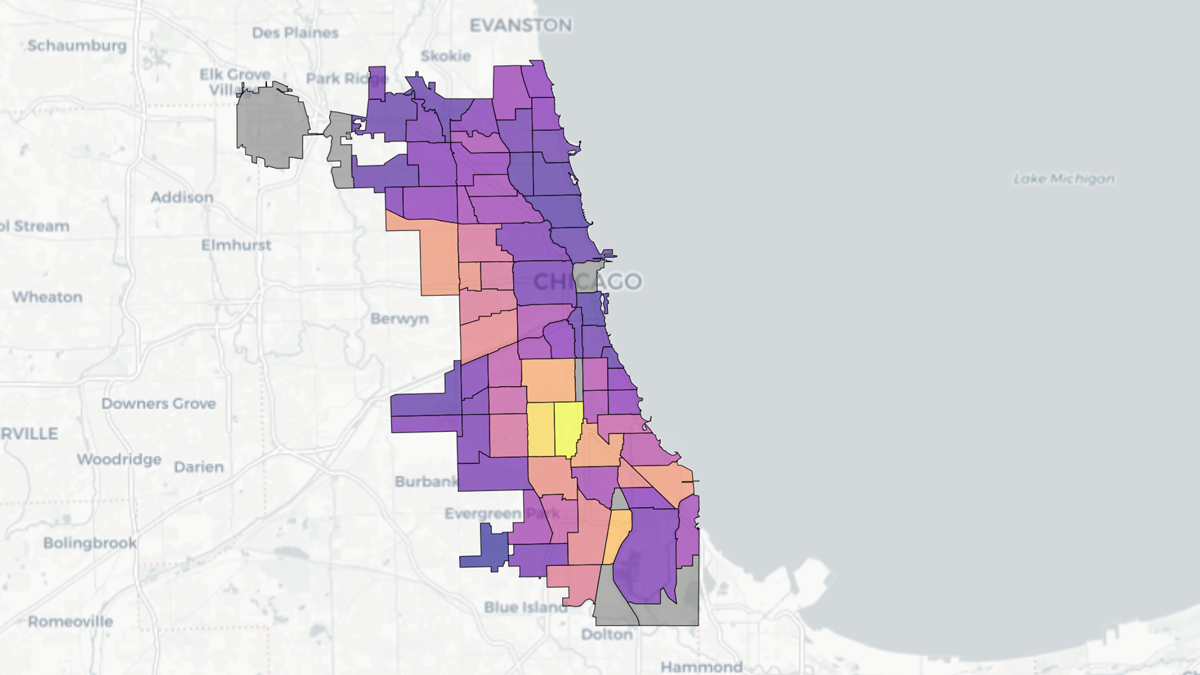
Thorstenson et al. analyzed 1,750 soil samples from Chicago’s 77 community areas. The researchers then used these data with the EPA’s Integrated Exposure Uptake Biokinetic model (IEUBK) to estimate how much lead children are likely to have in their blood. Comparing these data to actual EBLL findings from the Chicago Department of Public Health and accounting for factors such as household income, the age of housing, and the housing’s proximity to industrial land, the researchers built a comprehensive map that identifies the Chicago communities most at risk for soil lead exposure.
More than half of the citywide soil samples showed lead levels above the EPA’s recommended threshold of 200 parts per million—with some hot spots rising above 300 parts per million. When matched with the modeling from IEUBK, an estimated 27% of children across the city are at risk of EBLL. In the hot spot areas, that risk rises to 57%.
These findings suggest that though median household income is the strongest predictor of EBLL prevalence, soil lead levels are also a significant predictor. Systematic soil testing could become a crucial way to reduce children’s risk of lead exposure in contaminated areas, the authors say. (GeoHealth, https://doi.org/10.1029/2025GH001572, 2025)
—Rebecca Owen (@beccapox.bsky.social), Science Writer

