
Editors’ Vox is a blog from AGU’s Publications Department.
As environmental conditions change, it is increasingly important to understand the structure and properties of the Earth’s critical zone, the layer where rock, soil, water, air, and living organisms meet and interact. While several geophysical methods provide images of the subsurface, they do not directly measure rock properties, such as porosity and water saturation.
A new article in Reviews of Geophysics explores rock physics models, which help bridge the gap between these geophysical methods and rock properties. Here, we asked the lead author to give an overview of the critical zone, the different types of rock physics models, and some of the remaining challenges for researchers.
In simple terms, what is the critical zone?
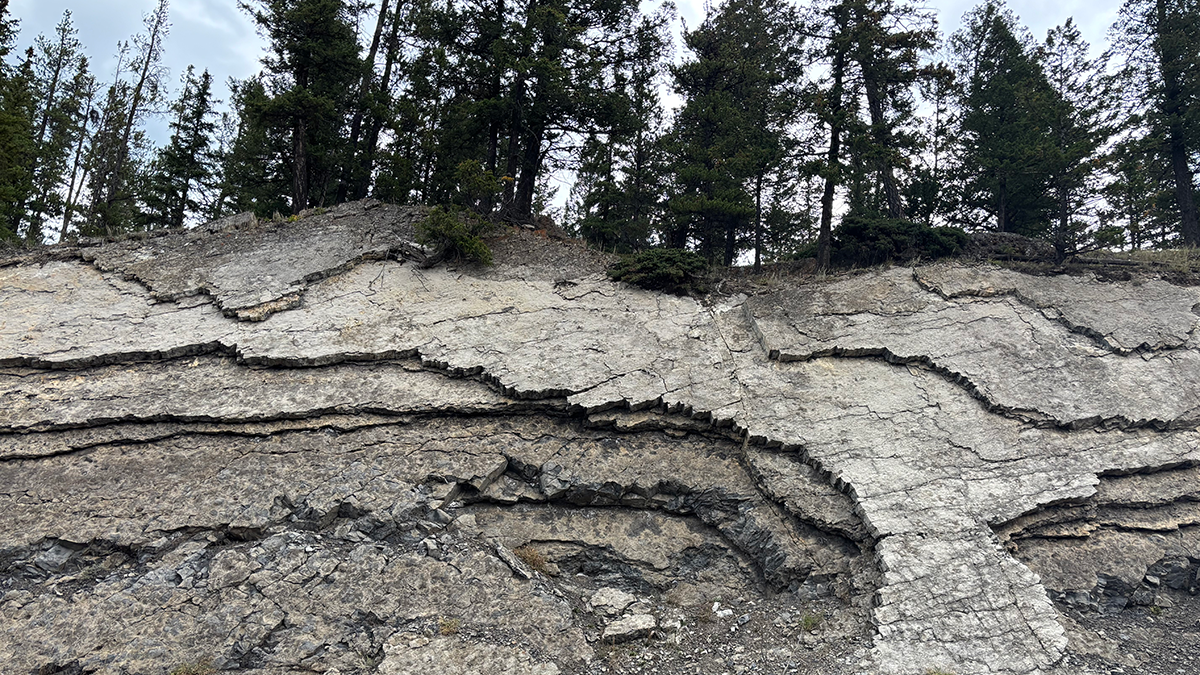
The critical zone is Earth’s thin outer layer that stretches from the tops of the trees down to the base of weathered bedrock.
The critical zone is Earth’s thin outer layer that stretches from the tops of the trees down to the base of weathered bedrock. Within it, physical, chemical, and biological weathering slowly transforms intact rock into a porous material that stores and transmits the water and nutrients ecosystems depend on. It is called “critical” because these near-surface processes sustain life, regulate water supplies, and shape landscapes over long timescales. Indeed, the critical zone controls how much water is available to plants, how groundwater is recharged, and how landscapes evolve over time.
What is the subsurface critical zone comprised of, and why is it important to study?
Below the soil, the subsurface critical zone grades downward from chemically altered and physically weakened rock (called “saprolite”), to fractured and partially weathered bedrock, and finally to fresh bedrock at the base. These layers are not sharply separated; they blend gradually, and their thicknesses vary with rock type, climate, topography, and tectonic history. This complex architecture governs how water infiltrates, how much is stored, and how it moves toward streams and plant roots. It matters because it controls water availability, groundwater recharge, nutrient cycling, and landscape evolution. Since it is hidden from direct view beneath our feet, we rely on indirect methods to map it across entire hillslopes.
Why is rock physics important for understanding the critical zone?
Rock physics supplies the missing bridge: it is the set of quantitative relationships that translate these geophysical signals into meaningful properties.
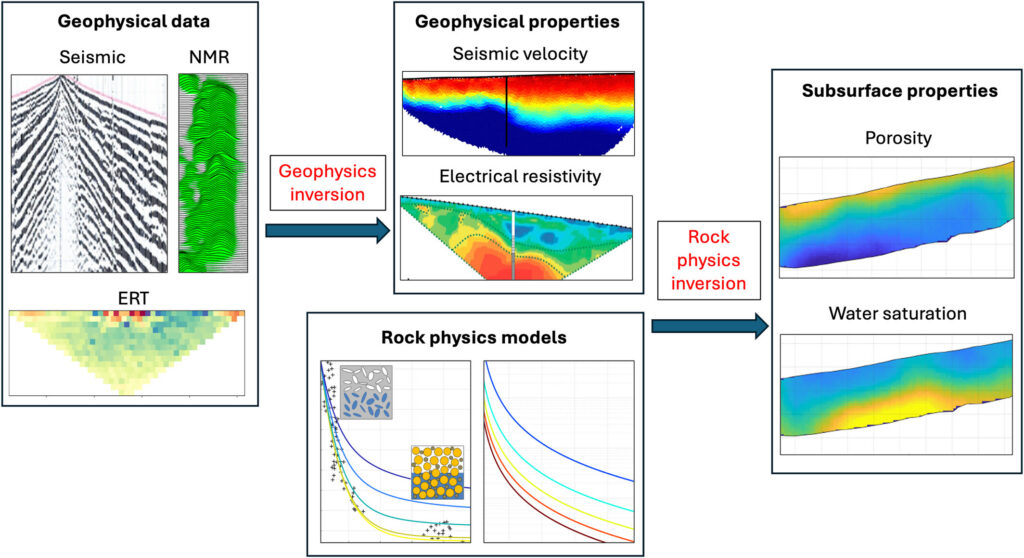
Geophysical surveys can image the subsurface over large areas, but they can’t measure the properties that critical zone scientists care about, such as porosity or water content. Instead, they record how signals (e.g., seismic waves, electrical currents, radar, or magnetic responses) move through the ground. Rock physics supplies the missing bridge: it is the set of quantitative relationships that translate these geophysical signals into meaningful properties such as porosity, water saturation, and permeability.
Without rock physics, a seismic velocity map is just a picture of how fast waves travel; however, that same picture becomes an estimate of how much water the subsurface can hold when rock physics is applied. This transforms qualitative images into quantitative characterization, letting us test ideas about weathering, water storage, and how the critical zone responds to climate and environmental change.
What are the most common geophysical methods that scientists use to study the critical zone?
Several complementary methods are used in critical zone studies. Seismic refraction and surface-wave techniques measure how fast elastic waves travel, revealing subsurface layering, weathering profiles, and depth to bedrock. Electrical resistivity tomography (ERT) injects current into the ground to map resistivity, which is sensitive to porosity, water content, and the presence of clay. Ground-penetrating radar (GPR) uses radio-frequency waves to produce detailed images of subsurface contrasts in dielectric permittivity due to boundaries in porosity, composition, and water content. Nuclear magnetic resonance (NMR) directly detects hydrogen in water, providing quantitative water content and pore-size information. Because each method senses a different physical property, combining them yields a fuller and less ambiguous picture of water and structure in the critical zone.
Why do scientists use rock physics models?
Geophysical images are inherently non-unique: different combinations of porosity, water, mineralogy, and structure can produce the same measured response. Rock physics models resolve this ambiguity by encoding the physical relationships between what we measure and the underlying rock and fluid properties. Some are empirical, derived from laboratory and field observations, while others are physics-based, built from first principles describing how grains, pores, and fluids behave. Combined with mathematical inversion, these models convert geophysical property fields into quantitative estimates of porosity, saturation, and permeability, as well as into estimates of the uncertainty in those values. This is what allows geophysical data to be integrated into hydrological and geochemical models of the critical zone.
What types of rock physics models are explored in your review article?
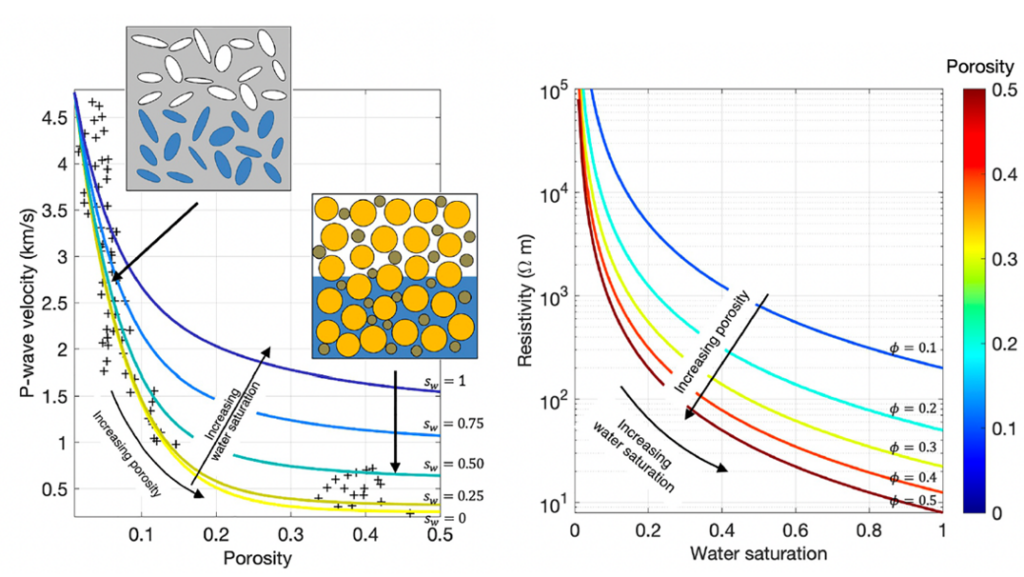
We review models grouped by the geophysical property they address. Elastic models link seismic velocities to porosity and saturation, using granular-media theories for loose, weathered material, inclusion models for fractured bedrock, and Gassmann’s equations to account for pore fluids. Electrical and electromagnetic models relate resistivity to porosity and water content. Dielectric mixing models connect GPR measurements to water content. NMR models tie relaxation signals to pore size, water content, and permeability. We also discuss soil physics effects, like matric suction, that become important in the shallow, unsaturated near surface where standard rock physics assumptions begin to break down.
What are some of the remaining challenges where additional research efforts are needed?
Several challenges remain. Weathered materials are far more heterogeneous than the sedimentary rocks most rock physics models were originally built for, so relationships are often site-specific and don’t transfer easily between locations. Calibrating and validating models requires direct measurements from cores or boreholes but this is expensive, coverage is sparse, and the process can alter the properties of the very material being sampled. Additionally, some properties are difficult to constrain from surface data alone. For example, permeability and fracture connectivity are critical for predicting water flow but are notoriously difficult to measure in the field. Relying instead on data from the lab has its own problems: laboratory samples are centimeters wide, while geophysical surveys average over meters. Promising directions include systematic laboratory measurements of critical zone materials, inversion methods that explicitly quantify uncertainty, physics-guided machine learning, and emerging monitoring technologies such as distributed acoustic sensing that can track subsurface changes continuously over time.
—Dario Grana ([email protected];  0000-0003-4220-053X), University of Wyoming, United States; Brady A. Flinchum ([email protected]; 0000-0003-0395-0450), University of Newcastle, Australia; Denys Grombacher ([email protected]; 0000-0003-2447-0085), University of Aarhus, Denmark; Andrew D. Parsekian ([email protected]; 0000-0001-5072-9818), University of Wyoming, United States; Clifford S. Riebe ([email protected]; 0000-0002-8744-8208), University of Wyoming, United States; and W. Steven Holbrook ([email protected], 0000-0003-0065-8841), Virginia Tech, United States
Editor’s Note: It is the policy of AGU Publications to invite the authors of articles published in Reviews of Geophysics to write a summary for Eos Editors’ Vox.