
It was winter in Fairbanks, Alaska, and the moose were grumpy.
A University of Alaska Fairbanks graduate student offered me a tip: “If you see their hair coming up, and they’re going to charge you?” he said. “Find a tree.”
I was joining a day of fieldwork with a group of Arctic scientists hunting an invisible gas that has been increasing in our atmosphere at an accelerating rate since 2007. Our destination, a lake a mere 15-minute drive from campus, has the highest rates of ecological methane emissions ever recorded from Arctic lake marshes.
Making total estimates of the gas in the Arctic—or even on the planet—is unbelievably complex, involving data collection from an area that spans 22 million square kilometers.
University of Alaska Fairbanks professor Katey Walter Anthony led the day’s fieldwork. She’s spent 2 decades studying high-latitude lakes in some of the most remote reaches of Alaska, Greenland, and Siberia.
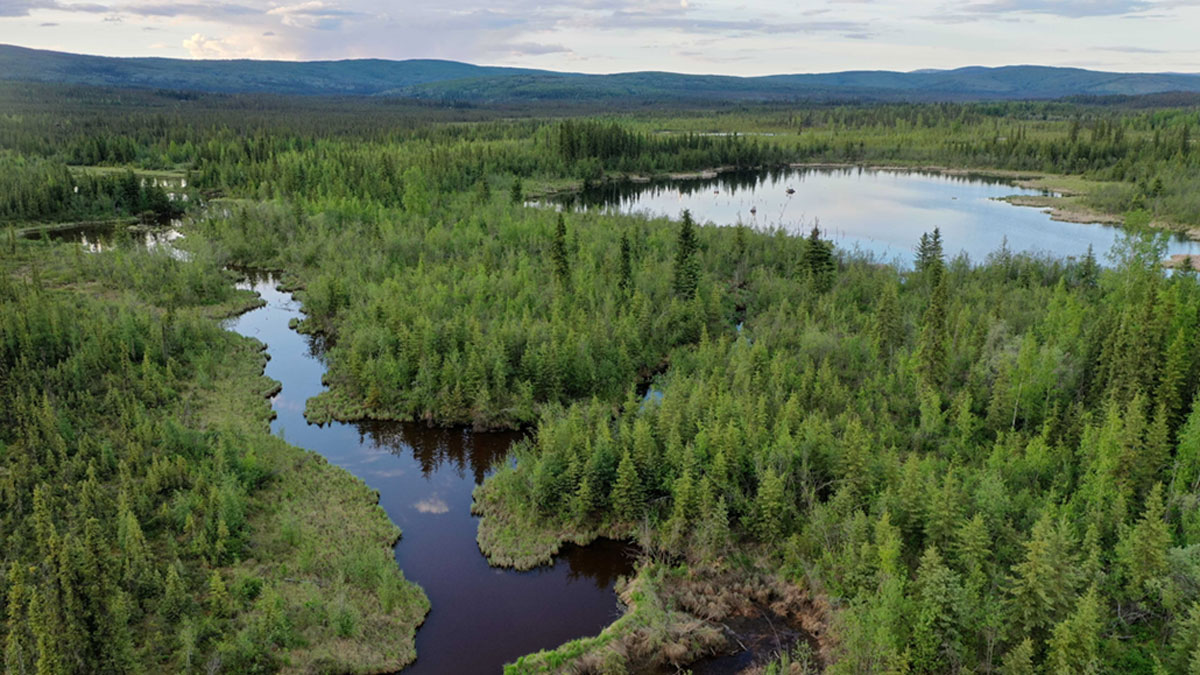
Only a 30-minute walk through a spruce forest on the outskirts of town, the lake is practically in some folks’ backyards.
Big Trail Lake is practically urban in comparison. Only a 30-minute walk through a spruce forest on the outskirts of town, the lake is practically in some folks’ backyards. But the placid nature of the lake can be deceiving: Big Trail Lake has a hidden hot spot of methane emissions.
Methane is around 80 times stronger than carbon dioxide in its first 20 years in the atmosphere, and scientists worry that methane emissions will continue to accelerate and exacerbate climate change. Unlike the rise of carbon dioxide in our atmosphere, which comes primarily from well-understood fossil fuel emissions, methane has many sources that are hard to constrain.
Curbing methane emissions from human sources like oil and gas production, landfills, and agriculture would limit warming. But natural sources of emissions, such as thawing permafrost, must also be well understood to model and forecast warming trends accurately.
Our trek to Big Trail Lake could bring scientists one step closer to understanding the causes of extreme methane emissions, or hot spots, in thawing permafrost. Hot spots occur throughout the Arctic, but scientists are still trying to find a way to predict their occurrence. The stakes are high: Permafrost in the Northern Hemisphere holds 10 times more methane than our atmosphere, and emissions could skyrocket as the frozen soil warms.
A Young, Fast-Growing Lake
I almost missed the lake when we came to it. Frozen over and topped with half a meter of snow, it didn’t look much different than the land around it. But then I saw the clues: Spruce trees outlined an oval shore. Trees tilted haphazardly: Their roots had become destabilized from permafrost thaw.
Katey Walter Anthony warned me to walk only along snowmobile tracks—otherwise, I might fall through a deceptively thin patch of lake ice.
As we walked onto the frozen lake, Walter Anthony warned me to walk only along snowmobile tracks—otherwise, I might break through a deceptively thin patch of lake ice. She spoke from experience, as she’d fallen through frozen lakes almost a dozen times in her career.
Walter Anthony told me that lakes like these—called thermokarst lakes—are popping up at high-latitude locations everywhere. Only 60 years ago, Big Trail Lake didn’t exist. Most likely, the lake formed when an ice wedge in the permafrost melted. The water warmed the permafrost around it, kicking off a vicious cycle of ice melt and permafrost thaw.
The permafrost below Big Trail Lake formed 35,000 years ago during the last ice age. As it thaws for the first time since the Pleistocene, microbes feast on the grasses and sticks and bones—releasing methane.
A Surprise
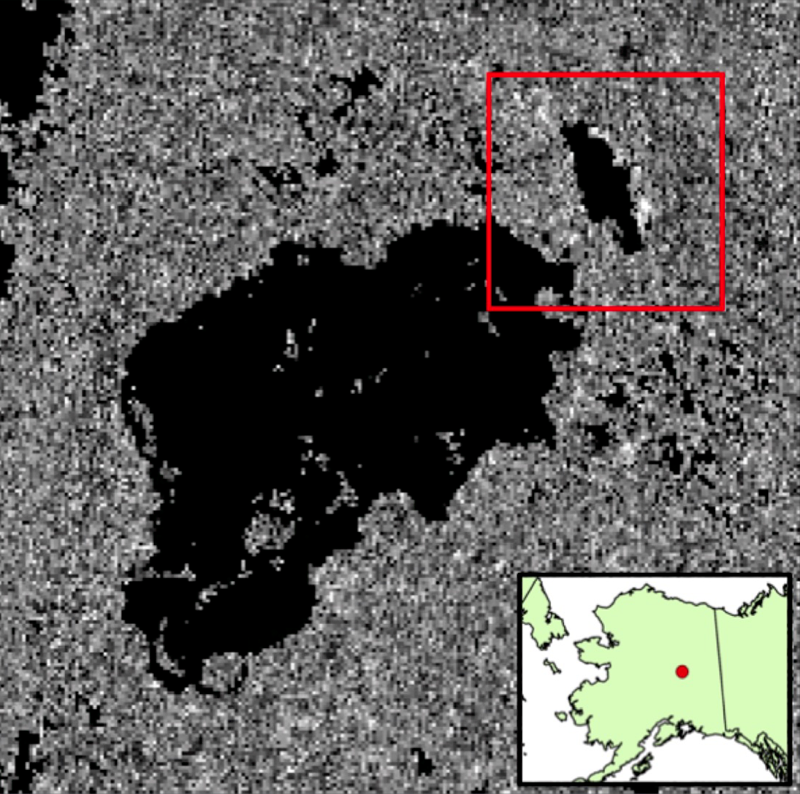
Years before our winter hike, aerial surveys at Big Trail Lake discovered something unexpected.
NASA scientists flew a sensitive device over the lake during the Arctic-Boreal Vulnerability Experiment (ABoVE) and detected a methane hot spot.
A section of the lake’s shoreline was blasting out more than 10,000 milligrams of methane per square meter per day, roughly the same rate as an average abandoned and plugged oil or gas well—an unusually high number for a natural source.
Clayton Elder, an Earth system scientist at the Jet Propulsion Laboratory working on ABoVE, was surprised. Elder and others had taken ground measurements at Big Trail Lake and hadn’t noticed the hot spot. But they confirmed the airborne findings when they returned to the exact location and measured an area they hadn’t focused on before.
According to Elder, Big Trail Lake’s hot spot accounted for 40% of the lake’s emissions but made up an area no larger than a living room.
Buckets
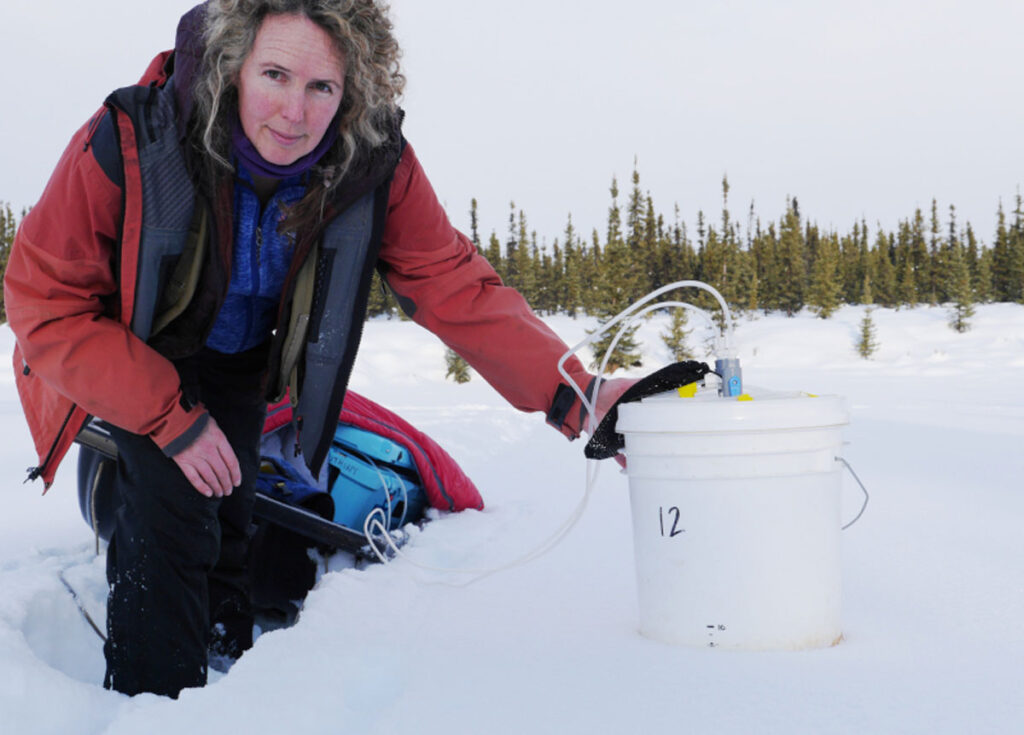
Back at the lake, Walter Anthony laid a plastic bucket upside down on the snow.
She was capturing gas diffusing out of the snow from the lake and permafrost below. Using a machine to analyze the gas inside the bucket, she measured the flux of methane out of the lake. She watched a live feed of the methane concentration values on her iPad and jotted down numbers in her notebook. The readings will allow her to estimate how much methane the lake emits.
Chamber measurements, in which gas is captured in a closed container like Walter Anthony’s bucket, are the bread and butter of methane research. They go into big synthesis reports, like a recent Earth System Science Data review of nearly 189 studies of methane emissions from boreal and Arctic regions. Combining data is necessary for model parameterization and validation, as well as making comparisons across sites and seasons.
But plans for the day went deeper than aboveground chamber measurements. Walter Anthony’s graduate student, Nick Hasson, was about to peek below the lake’s surface.
Submarines
“Think of VLF as the global Wi-Fi network for submarines.”
Though we were more than a thousand kilometers from the ocean, Hasson was about to measure waves—electromagnetic waves 10 times the height of Mount Everest that were pulsing all around us. These very low frequency (VLF) waves, in the 3- to 30-kilohertz radio range, stretch 10 to 100 kilometers from crest to crest. Measuring VLF waves is a clever way of peering down at the permafrost below.
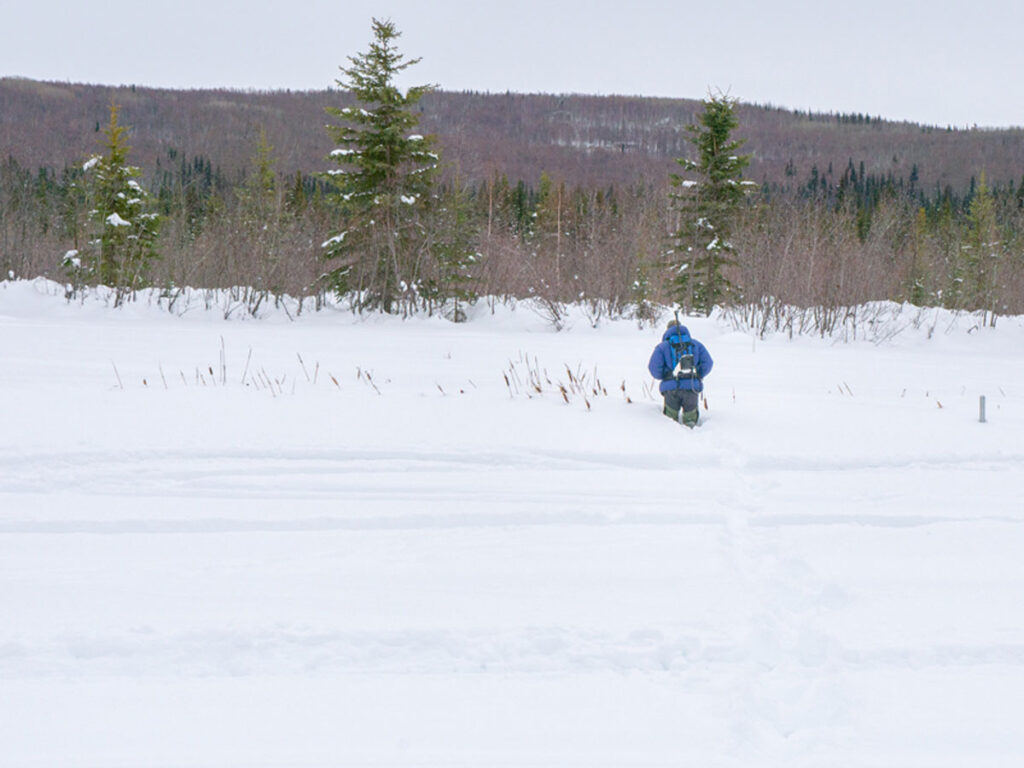
Hasson headed for the lake’s far edge. Using a receiver mounted to a backpack, he picked up a 21.3-kilohertz signal from the Lualualei VLF transmitter in Oahu, Hawaii, primarily used for military communication with nuclear submarines. “Think of VLF as the global Wi-Fi network for submarines,” Hasson said as he slowly walked a straight line across the lake, taking measurements.
VLF waves travel differently depending on the electrical resistivity of the ground’s surface. Just like an ocean wave approaching the shore morphs according to the shape of the beach, a VLF wave will warp with a change in the resistivity below it. Frozen permafrost and thawing permafrost have very different resistivities, so the thawing edge along the lake’s boundary is a great place to see the waves morph and change.
The VLF waves appearing on Hasson’s screen told him that the permafrost below was thawing in great fingers extending beyond the lake’s boundaries like wings.
Hasson has traveled this path across the lake with his VLF receiver every 2 weeks, rain or shine, for more than a year. In the summer, he kayaked. During the winter, he walked through the snow, hail, or sideways wind in temperatures as low as −30°C.
Hot Spot Holdouts
It was almost evening as Hasson finished his work. The Sun dipped toward the horizon, and the sound of snowmobiles crooning in the distance faded. It was a Saturday, but no one seemed to mind spending it knee-deep in the snow.
Hasson hopes that combining the bucket measurements with the VLF wave data will reveal the underlying drivers of Big Trail Lake’s hot spot.
His preliminary findings show that hot spots are associated with the lowest resistivity readings. The drivers of hot spots appear to be the topographic boundaries of the thermokarst thaw, the position of the water table, the hydraulic connectivity underground, and the geomorphology of the wetland around them.
Understanding and predicting the sources of hot spots will be crucial for making Arctic-wide estimates. The ABoVE campaign found about 2 million methane hot spots across 73,000 square kilometers.
Thermokarst hot spots put out about a teragram of methane per year, about 4% of the Arctic’s methane budget. But these emissions come from an area that makes up less than 0.005% of Arctic permafrost.
Walter Anthony believes that permafrost thaw could noticeably contribute to methane emissions within 10 years. But global climate models still don’t have the resolution to factor in geographically small, but powerful, hot spots like the one found at Big Trail Lake.
That’s why buckets and submarine calls and Saturdays spent at work matter, I realized. We must figure out the details of Arctic methane now while the giant of permafrost still sleeps. Blanketed in the snow beneath our feet, its 35,000-year slumber is ending.
—Jenessa Duncombe (@jrdscience), Staff Writer
The Curve is a series charting the mysterious rise of methane in our atmosphere and the quest to find its source.