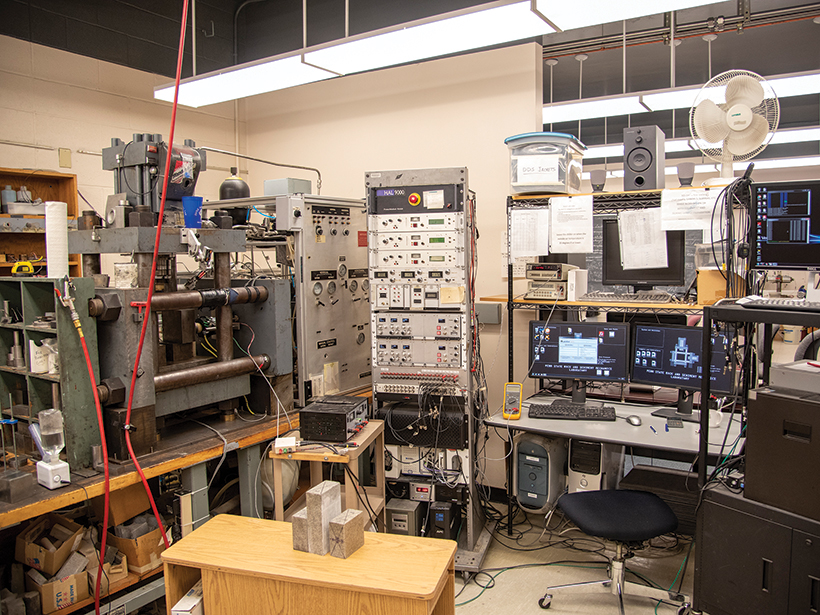
On a sturdy workbench in seismologist Chris Marone’s lab on the fifth floor of the geosciences building at Pennsylvania State University (Penn State) sits a large steel-framed machine with thick hydraulic pistons that force metal blocks and plates to grind past each other under extreme pressure.
The plates, and the ground-up rock between them, are replicas of the slip surfaces and fault gouge found in natural fault systems, but the forces at work when the plates stick and slip are real.
When the device is running, Marone sometimes closes the door to the lab so the loud bangs of “laboratory earthquakes” do not disrupt people across the hall. Lately, however, it has been the quieter sounds emanating from the machine that have caused a disruption in the field of seismology.
In a recent spate of studies, researchers applied machine learning to acoustic emission data from Marone’s earthquake machine, as well as from natural faults. The work led to the discovery of a new relationship between a fault’s acoustic emissions and its physical characteristics, including its frictional state, its displacement rate, and the timing and magnitude of its next failure.
The work the team is doing, “where they can take these laboratory experiments and find information in between slip events, is a breakthrough at the laboratory scale,” said Harold Tobin, director of the Pacific Northwest Seismic Network.
Within the past few years, scientists have used machine learning to identify earthquakes in seismic data at lower magnitudes than were previously detectable (thus producing higher-fidelity earthquake catalogs), estimate fault displacement rates, detect similarities between fast- and slow-slip events, and predict times until fault failure.
These findings from out in the field, along with the novel combination of machine learning and laboratory earthquake setups, have raised tantalizing possibilities for the application of these techniques in developing improved earthquake forecasting and early warning systems, perennial challenges in seismology.
Tabletop Earthquakes
Natural faults are exceedingly complex. The geologic setting, rock type, strain, stress, and friction regimes are different for every fault, making precise predictions of the timing or traits of any given earthquake virtually impossible.
But what if earthquakes could be standardized, reproduced, instrumented, and studied up close in a laboratory? That’s just what some researchers—experimental seismologists—have been doing for the past 60 years using a variety of apparatuses and machines to reproduce the high-pressure, high-temperature environments of Earth’s interior.
In the middle to late 20th century, experimentalists—including researchers at the University of California, Los Angeles; Harvard University; the Massachusetts Institute of Technology (MIT); Brown University; and the U.S. Geological Survey’s Rock Physics Lab in Menlo Park, Calif.—invented machines that revealed new knowledge about rock and mineral physics, including new laws of friction. The descendants of those machines have contributed to the revolution in seismology spurred by the discovery in the past 2 decades that faults can display a spectrum of previously unseen behaviors, including episodic tremor and slip (ETS), low-frequency earthquakes, and slow-slip earthquakes.
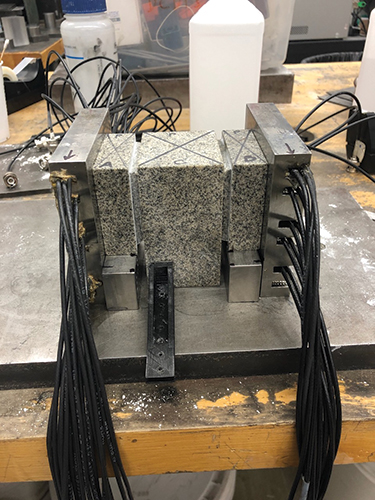
Marone’s biaxial device is modeled after the first such machine built at Menlo Park. It features two hydraulic pistons, one vertical and one horizontal. The vertical piston forces a steel plate, measuring about 30 × 30 centimeters, down between two steel loading blocks, which are compressed by the horizontal piston. The combined forces place frictional loads on both sides of the center plate, which is coated with various types of ground-up rock, or gouge, found on fault surfaces in nature.
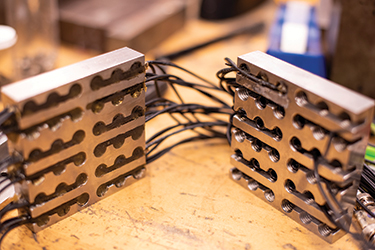
The design allows researchers to apply forces of up to 1 million newtons—comparable to those that occur in some natural systems—while precisely controlling stress and displacement to produce a wide range of earthquake behaviors under repeatable conditions. Among the instruments used to monitor the machine, piezoelectric sensors record acoustic signals that are emitted during experiments.
Marone has worked with the machine for 30 years, first at MIT and then at Penn State, to coax various earthquake behaviors out of it. He now has the ability to reproduce the full spectrum of fault failure modes, from stable creep to the dynamic rupture of regular earthquakes.
“We have to think about all the complexity in real-world fault zones,” Marone said, “but many of the things that happen in real fault zones [also] happen in the lab.”
From Replica to the Real World
“The bugaboo with any kind of scaling of laboratory slip mechanics to earthquakes is just the incredible jump in scale and the complexity,” said Tobin. “The question is, Will it scale to real-world earthquakes?”
One reason seismologists think lab quakes can be a viable model of the physics occurring in natural fault zones and earthquakes is that they exhibit similar frequency-magnitude distributions. Seismic event distributions in both nature and the laboratory are characterized by a large number of small quakes and a small number of large quakes. In 1944, Beno Gutenberg and Charles Richter noted that this relationship between frequency and magnitude obeys a power law [Gutenberg and Richter, 1944]. And in the 1960s, seismologists, including Christopher Scholz, who would later become Marone’s doctoral adviser, discovered that this frequency-magnitude distribution changes before an earthquake.
We’ve known for 50 years that this relationship “changes subtly and systematically during laboratory earthquakes,” Marone said. “But we didn’t know how or how much it has to change, so it didn’t have any predictive value.”
That acoustic signals emanating from faults exhibit a similar pattern has also been known since the 1960s [Lei and Ma, 2014], leading seismologists to posit that the signals could provide valuable information about a fault.
Melding Machine and Machine Learning
About 5 years ago, Paul Johnson, a geophysicist at Los Alamos National Laboratory (LANL) in New Mexico, found himself stuck as he was studying how acoustic emissions might be used in earthquake forecasting.
“We were kind of running in circles with the same data sets, and I just didn’t know what to do,” he said. A colleague suggested that Johnson look into applying machine learning “to let the signal tell you what information it contains.”
Johnson began talking to other physicists, materials scientists, computational scientists, and mathematicians about the possibility. Bertrand Rouet-Leduc, then a graduate student at the University of Cambridge in the United Kingdom using machine learning techniques to improve gallium nitride LEDs, took an interest.
At about that same time, Marone gave a talk at LANL, after which Rouet-Leduc, who is now a postdoctoral researcher at LANL, approached him.
Machine learning requires very large data sets to train algorithms, posing a challenge for studying natural fault systems, where ruptures often have recurrence intervals of tens to hundreds of years.
They discussed how machine learning requires very large data sets to train algorithms, posing a challenge for studying natural fault systems, where ruptures often have recurrence intervals of tens to hundreds of years. Continuous seismic monitoring, which today detects many earthquakes not previously recorded and helps supply such data sets, has been available only for the past few decades or so. Rouet-Leduc told Marone that to accurately train and test an algorithm, data from hundreds of events would be needed. “I said, ‘I can give you 500 earthquakes,’” Marone said.
Within a few weeks of beginning the project, the researchers had developed their first machine learning model using a “random forest” decision tree algorithm. And they were seeing intriguing results, with the model accurately predicting friction on the laboratory fault. “That’s how quickly it happened,” Johnson said, “and suddenly [this research] exploded.”
The Noise Is the Signal
The researchers set to work applying the algorithm to the much larger data sets supplied by Marone’s model fault. They first trained it to look at hundreds of statistical variables—such as amplitude, mean, median, variance, and standard deviation—that characterize the faults’ acoustic signals and to identify patterns or relationships between those variables and selected traits, such as shear stress and ground displacement. After training the algorithm on part of a data set, they tested it on another part that the algorithm had not yet seen.
Previous work [Dieterich and Kilgore, 1996] had found that you can derive the friction on the lab fault “from the amount of foreshock activity right before the main event, but not during the rest of the cycle,” Rouet-Leduc said. The new research revealed a previously unknown fundamental relationship between the sound emitted by the laboratory fault and its physical state at all times, the team reported in Geophysical Research Letters in September 2017 and February 2018 [Rouet-Leduc et al., 2017, 2018].
The researchers identified signals previously thought to be “noise” that actually “carry information about the state of the fault,” said Greg Beroza, a seismologist at Stanford University who is not involved in the work. “By discerning relationships between these newly recognized signals and slip state, they were able to forecast, for example, the time of failure in a laboratory setting.”
“We were stunned when we started to see these results,” Johnson said. The team had previously looked at acoustic signals using conventional techniques like Fourier analysis and had found nothing. “I couldn’t believe that the signal that we had discarded was the most important signal in the system.”
Contrary to expectations, the results also overturned a long-standing idea that locked faults repeatedly build up stress until they overcome static friction, rupture, slip a little, and then become locked again.
“That’s not what’s going on in the faults we’re looking at in the laboratory or with slow slip in the Earth,” Johnson said. “What’s happening is the fault is slipping all of the time and radiating this signal that’s telling us about the fault physics” and about an upcoming failure.
The next step was to train and test the algorithm on acoustic signals from a natural fault system. For this, researchers turned to the Cascadia subduction zone (CSZ), the massive subduction zone that poses significant seismic and tsunami hazards for communities all along the Pacific Northwest coast.

The fault zone hasn’t experienced a megaquake since January 1700, but it does exhibit ETS episodes on cycles of 13–14 months, which have been recognized since 2001 and provide a good stream of data to analyze.
“What we find using machine learning is that we are able to dig out additional signals at all times that inform us on the state of the fault,” said Rouet-Leduc. He and his colleagues published their investigation of the CSZ in Nature Geoscience in January 2019 [Rouet-Leduc et al., 2019].
The researchers were able to connect the acoustic signal generated by tremor with the slow-slip fault displacement measured by GPS.
“It has been known for a while that there is a proportionality between slow slip, as measured geodetically, and tremor, as measured seismically,” Beroza said. “What’s new in this study is that the proportionality appears to be continuous. That is, even when there is no clearly identifiable signal, such as a tremor burst, there is a relationship between the weak seismic shaking and the geodetically measured slow slip,” he said. “This is suggestive of the relationship seen in the laboratory.”
Deep Learning on Deep Quakes
The researchers are now applying machine learning to other long-standing questions about fault behavior.
Claudia Hulbert, a doctoral student at LANL and École Normale Supérieure in France, used the random forest algorithm and additional lab earthquake acoustic data to examine and compare characteristics of fast and slow earthquakes.
Slow earthquakes occur deep in fault zones and exhibit kilometers-per-day velocities rather than the kilometers-per-second speeds of regular quakes. They are of interest to scientists because they alter the stress on shallower, locked portions of faults and often precede major earthquakes.
Hulbert and colleagues reported, also in Nature Geoscience in January 2019, that different types of fault slip share similar mechanisms [Hulbert et al., 2019]. This “suggests that catastrophic earthquake failure may be preceded by an organized, potentially forecastable, set of processes,” the team wrote.
They also used machine learning to probe connections between episodic tremor and slow earthquakes. In the authors’ latest paper, submitted to Geophysical Research Letters in August, they used a new method of machine learning, a convolutional neural network also called “deep learning,” to detect tremor in the seismic signal from slow earthquakes in Cascadia.
Like the random forest method, the deep learning model is trained. But unlike random forest, in which researchers prescribe which variables the algorithm looks at and the outcomes it should look for, a deep learning network independently determines what patterns and connections are significant.
The advantage of the random forest approach is its transparency, but the disadvantage is that researchers may not think to consider important aspects of the data, Beroza said. “Deep learning has the disadvantage of being opaque in the sense that it is not always clear how a prediction is being made,” he said. However, “the algorithm is free to explore relationships between data and predictions that a researcher may not have thought to explore.”
Using data from multiple seismic stations in Cascadia containing known slow earthquakes, Hulbert and colleagues trained the neural network to identify tremor. The algorithm was then able to isolate tremor in other Cascadia seismic data from just a single station. Without any additional training, the algorithm was also able to identify tremor in data from the Shikoku subduction zone in Japan and from the San Andreas Fault in California—two very different tectonic settings—suggesting that the characteristics of the acoustic waves produced by tremor are universal.
“It’s very exciting to me that the same kind of observation they made in the laboratory applies to Cascadia,” Tobin said. “Again, the caution I would say is that tremor is not the same as the regular large earthquakes that we worry about.”
The (Seismic) Wave of the Future
Whether the research combining seismic data—from both lab-generated and natural earthquakes—with machine learning will ultimately allow scientists to predict earthquakes, including destructive subduction zone megaquakes, is, of course, a fundamental question for the team, Johnson said. However, he added, the primary goal right now is to improve our basic understanding of fault physics.
“The real Earth is a hot mess, with strong geologic variations, varying amounts of pore fluids, and…complex fault systems that interact strongly.”
Beroza said that the work may contribute to improving the rapidity of earthquake early-warning systems but that he’s not holding his breath that it will suddenly revolutionize earthquake forecasting. “The laboratory systems they have studied are controlled experiments in relatively clean systems where the samples are isolated and easily observed,” Beroza said. “The real Earth is a hot mess, with strong geologic variations, varying amounts of pore fluids, and…complex fault systems that interact strongly.” Still, he noted, “the laboratory experiments are highly motivating and highlight important aspects of the system that we should look for in the real Earth.”
Although there are currently no fixed plans to develop a practical application based on the team’s machine learning algorithms, it’s possible it could be used for real-time monitoring, Rouet-Leduc said. “That’s something we have in the back of our mind.”
Meanwhile, the team’s flurry of recent studies, as well as a range of other efforts to integrate machine learning into the geosciences, could portend a tipping point for its use in the discipline.
“We’re seeing really just the beginning. This is going to completely take over all of science, and certainly geoscience, in the next 5–10 years,” Johnson said. “Everybody is going to be using this as a basic tool set to work with their data.”
References
Dieterich, J. H., and B. Kilgore (1996), Implications of fault constitutive properties for earthquake prediction, in Earthquake Prediction: The Scientific Challenge, pp. 3,787–3,794, Natl. Acad. Press, Washington, D.C., https://doi.org/10.17226/5709.
Gutenberg, B., and C. F. Richter (1944), Frequency of earthquakes in California, Bull. Seismol. Soc. Am., 34(4), 185–188, https://resolver.caltech.edu/CaltechAUTHORS:20140731-150249818.
Hulbert, C., et al. (2019), Similarity of fast and slow earthquakes illuminated by machine learning, Nat. Geosci., 12, 69–74, https://doi.org/10.1038/s41561-018-0272-8.
Lei, X., and S. Ma (2014), Laboratory acoustic emission study for earthquake generation process, Earthquake Sci., 27(6), 627–646, https://doi.org/10.1007/s11589-014-0103-y.
Rouet-Leduc, B., et al. (2017), Machine learning predicts laboratory earthquakes, Geophys. Res. Lett., 44, 9,276–9,282, https://doi.org/10.1002/2017GL074677.
Rouet-Leduc, B., et al. (2018), Estimating fault friction from seismic signals in the laboratory, Geophys. Res. Lett., 45, 1,321–1,329, https://doi.org/10.1002/2017GL076708.
Rouet-Leduc, B., C. Hulbert, and P. A. Johnson (2019), Continuous chatter of the Cascadia subduction zone revealed by machine learning, Nat. Geosci., 12, 75–79, https://doi.org/10.1038/s41561-018-0274-6.
Author Information
Sara E. Pratt ([email protected]), Science Writer
Citation:
Pratt, S. E. (2019), Machine fault, Eos, 100, https://doi.org/10.1029/2019EO136667. Published on 25 November 2019.
Text © 2019. The authors. CC BY-NC-ND 3.0
Except where otherwise noted, images are subject to copyright. Any reuse without express permission from the copyright owner is prohibited.