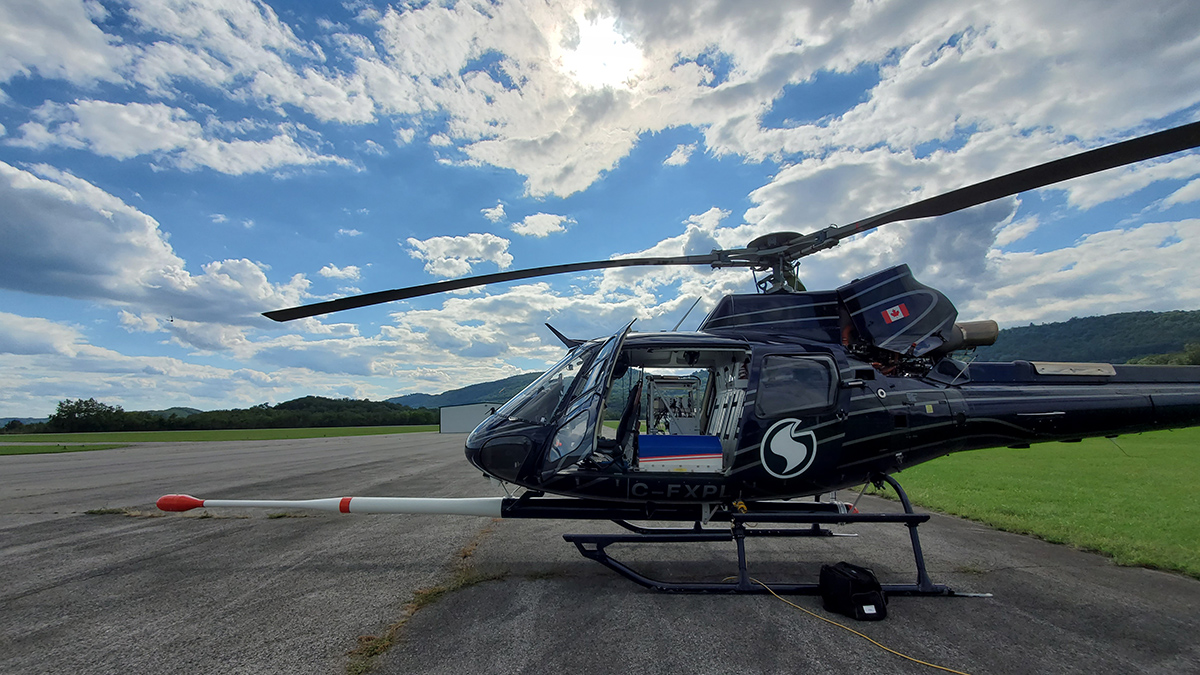
A helicopter flies low over the Appalachian Mountains, moving slowly above mostly forested lands of Maryland, Pennsylvania, and West Virginia. The aircraft carries a blue-and-white box holding instrumentation to detect unseen photon gamma rays created by radioactive decay within the rocks below. When a gamma ray reaches a specially designed crystal inside the box, it produces a flash of light—a reaction called scintillation—that provides information about the gamma ray’s properties and origins.
Measurements of natural, low-level radioactivity have been used in geologic applications for nearly a century.
Scintillation is the foundation of radiometric methods that provide passive and rapid assessments of the geochemical compositions of rock samples, cores, and outcrops, as well as of swaths of Earth’s surface. These methods measure ambient gamma ray energy signatures to determine which isotopes most likely produced them. Such data are then used to create maps of Earth’s surface and near subsurface where radioactive elements are present, even in low amounts.
Measurements of natural, low-level radioactivity have been used in geologic applications for nearly a century. But a new phase of open-access, high-resolution, airborne data collection funded and executed through the U.S. Geological Survey’s (USGS) Earth Mapping Resources Initiative (MRI) is providing novel insights for geologic mapping, critical minerals research, mine waste studies, and other applications.
From Geiger Tubes to Spectrometry
Radiometric methods developed rapidly following the discovery of radioactivity in 1896. Only a few decades later, petroleum explorations in the 1930s made use of Geiger tubes and ionization chambers to measure gamma rays emitted from boreholes. These early methods, which counted the total number of gamma rays detected, couldn’t discern individual radioelements, but they could reveal different sedimentary layers.
By the 1940s, scintillation crystals were light enough that instruments could be carried aboard airplanes for use in total-count radiometric surveys. And by the late 1960s, gamma ray sensors were accurate enough to distinguish specific source isotopes, providing capabilities for full gamma ray spectrometry [Duval, 1980; International Atomic Energy Agency, 2003].
Airborne gamma ray spectrometry provides rapidly and continuously collected geochemical information over large areas that is impossible to obtain from the ground.
During an airborne radiometric survey, an airplane, helicopter, or drone flies back and forth in a “mow-the-lawn” pattern to produce map view estimates of radioelement concentrations. The spatial resolution of the data depends on how closely the survey flight lines are spaced and on flying height: The farther the sensor is from the ground, the wider the area that is imaged—and the lower the resolution—at each point in time.
The results represent gamma rays emitted from roughly the upper 50 centimeters of the ground surface, whether bedrock or soil; shielding of these rays by vegetation is typically limited. Although many radioelements produce gamma rays, potassium, uranium, and thorium are the primary elements evaluated because they are relatively abundant on Earth and their decay sequences generate gamma ray signatures strong enough to be measured by airborne sensors [Minty, 1997; International Atomic Energy Agency, 2003].
Airborne gamma ray spectrometry provides rapidly and continuously collected geochemical information over large areas that is impossible to obtain from the ground. These surveys are often paired with simultaneous collection of magnetic data because the optimal flying speeds and heights are similar for both. These methods, when combined with ground truth geologic observations and sample analyses, offer a powerful tool for geologic mapping.
Resource Exploration Drives Data Collection
The earliest airborne radiometric datasets were total-count surveys collected primarily for uranium exploration by Australia, Canada, the Soviet Union, and the United States immediately after World War II. In the 1970s, continued interest in uranium led to initiation of the National Uranium Resource Evaluation (NURE), which supported airborne gamma ray spectrometry surveys measuring potassium, thorium, and uranium over the conterminous United States and parts of Alaska. These data, along with concurrent magnetic data, were released publicly. Around the same time, similar interest in Australia and Canada motivated regional-scale coverage in those countries.
To achieve national coverage, the NURE surveys were designed with very widely spaced flight lines 5–10 kilometers apart, and only a few areas were chosen for higher-resolution data collection. The data were useful primarily for reconnaissance rather than detailed exploration.
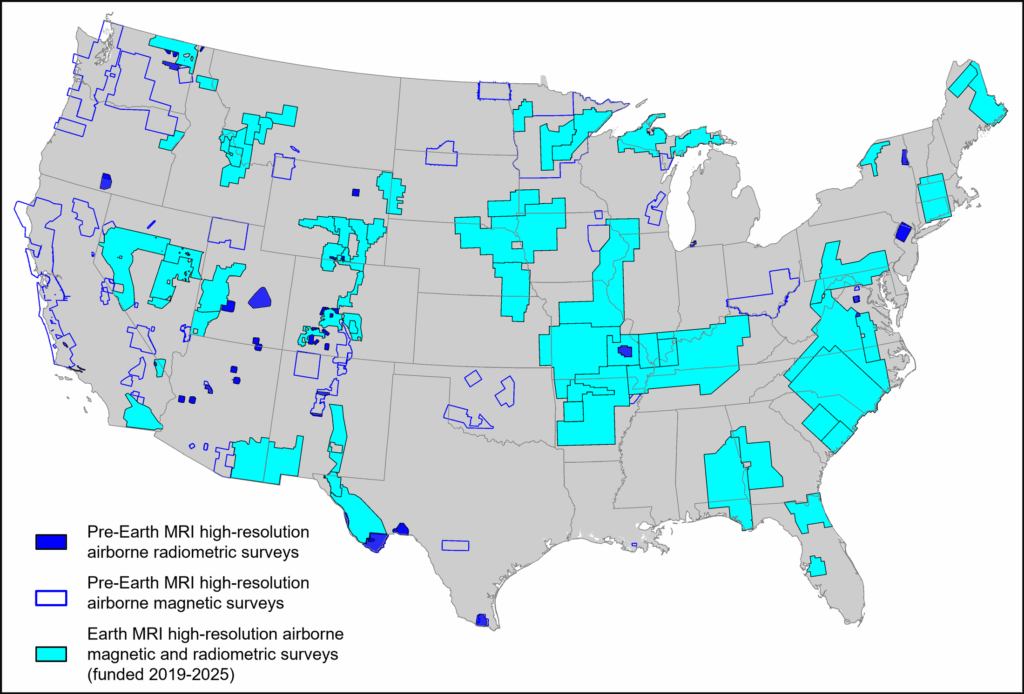
In the decades following the NURE surveys, sensor and processing technology improved remarkably, but only a limited number of public high-resolution radiometric surveys—covering about 1% of the country’s area—were flown in the United States (Figure 1). The lack of radiometric data was even more severe than that of magnetic data, which by 2018 covered almost 5% of the country [Drenth and Grauch, 2019]. Magnetic surveys were more common, perhaps because of their use for mapping buried faults, folds, and other geologic features in studies of mineral resources, natural hazards, and water resources (Figure 1).
Since 2019, Earth MRI has been addressing this data scarcity, with the goal of improving knowledge of domestic critical mineral resources and the geologic regimes, or frameworks, within which they form and concentrate. Critical mineral resources such as lithium, graphite, rare earth elements (REEs), and many others are commodities that are essential for the U.S. economy and security but are at risk from supply chain disruptions. They are key components in numerous technologies, from cell phones and medical devices to advanced defense systems and renewable energy technologies.
These datasets and interpretations can also inform studies in other disciplines, such as of earthquake hazards.
Earth MRI takes a multidisciplinary approach that includes geologic mapping and collection of new data using lidar, airborne geophysical methods, and analyses of sample geochemistry, mineralogy, and geochronology. These datasets and interpretations, all freely and publicly available, provide broad information about critical minerals, their mineralizing systems, and their geologic frameworks. Such information can also inform studies in other disciplines, such as of earthquake hazards, and is especially useful for advising land use planners (e.g., in making decisions about setting areas for natural preservation, grazing, and recreation) and for informing and reducing the economic risk of costly mineral resource exploration.
Magnetic and radiometric data are the foundation of Earth MRI’s airborne geophysical coverage because they provide valuable information about geology, including areas under cover and vegetation, and their relatively low cost enables surveying of large areas. Additional funding from the 2021 Infrastructure Investment and Jobs Act has facilitated targeted studies using both hyperspectral and electromagnetic methods, which provide complementary imaging.
Bird’s-Eye Views of Geology
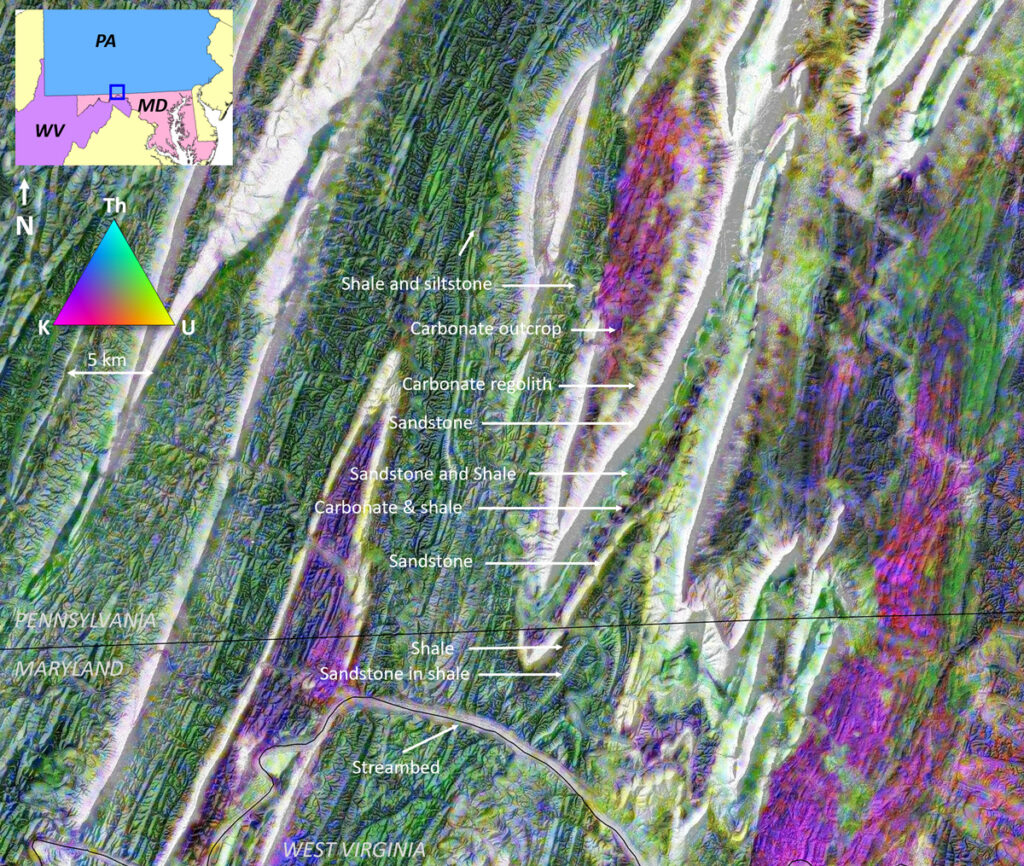
Heavily folded and faulted sedimentary rocks of the Appalachian Valley and Ridge Province provide a dramatic example of the value of Earth MRI’s data collection for geologic applications. Earth MRI supported new airborne magnetic and radiometric data collection in 2022–2023 in this region to better understand the geologic framework of critical minerals in metal-bearing shales and manganese-iron sedimentary layers (Figure 2).
The data illustrate a diverse array of lithologies in close proximity (sometimes <1 kilometer apart), reflecting the structure and stratigraphy of layered sedimentary rocks. They reveal outcrops of shale formations containing varying amounts of potassium, thorium, or both, highlighting compositional information. Weathered carbonates and carbonate regolith show only elevated levels of potassium, whereas quartz sandstone is mostly devoid of radioelements except for sparse patches of uranium enrichment.
Accurate interpretation of airborne radiometric datasets requires complementary geologic knowledge from other sources because the presence of potassium, thorium, and uranium can be linked to several different minerals. For example, in hard rock terranes, elevated potassium often indicates mica and potassium feldspar in granites, granodiorites, or felsic volcanic rocks. However, elevated potassium may also indicate a history of hydrothermal alteration that formed potassium-rich minerals associated with economically significant ores, such as gold-copper porphyry deposits [e.g., Shives et al., 2000].
Radiometric detections of potassium can illuminate broad transport pathways from sites of erosion to sites of deposition.
In sedimentary environments, elevated potassium measurements may represent minerals such as illite. Or they may indicate recently eroded sands (from which potassium has not been dissolved and mobilized), such as those found in river floodplains. In those scenarios, radiometric detections of potassium can therefore illuminate broad transport pathways from sites of erosion to sites of deposition [Shah et al., 2021].
Colocated magnetic field data can provide needed complementary constraints on geologic interpretations, especially within hard rock terranes. For example, both mafic rocks and quartz sandstone usually show similarly low potassium, thorium, and uranium signatures. However, mafic rocks often express prominent magnetic anomalies, unlike quartz sandstone, allowing scientists to easily distinguish the two.
Critical Mineral Frameworks
In addition to their use for fundamental geologic mapping, new Earth MRI datasets are providing key information on domestic critical minerals—and in some cases imaging them directly. This is especially the case for REEs because many minerals that host REEs also contain thorium. For example, at California’s Mountain Pass, presently the only site of active REE production in the United States, airborne radiometric data show elevated thorium, uranium, and potassium concentrations over mineralized areas [Ponce and Denton, 2019].
Airborne radiometric surveys have also led to discoveries of critical minerals. In one case, data from a remote part of northern Maine revealed a highly localized thorium and uranium anomaly. The finding motivated a subsequent effort in which a multidisciplinary and multi-institutional team quickly investigated the area on foot. By combining geophysical data, geologic mapping, and analyses of rock samples, they discovered an 800- × 400-meter area with high concentrations of REEs, niobium, and zirconium, all considered critical commodities [Wang et al., 2023]. The depth of the mineralization, and thus the potential economic value, is not yet known, but a deposit in Australia with similar rock type, composition, and areal extent has been valued in the billions of dollars.
In another study, researchers used Earth MRI radiometric data collected over Colorado’s Wet Mountains to map REE mineralization in carbonatite dikes, veins in alkaline intrusions, and syenite dikes [Magnin et al., 2023]. Additional analyses of thorium levels and magnetic anomalies provided insights into the geologic environment in which these REE-bearing features formed, namely, that the mineralization likely occurred as tectonic forces stretched and rifted the crust in the area.
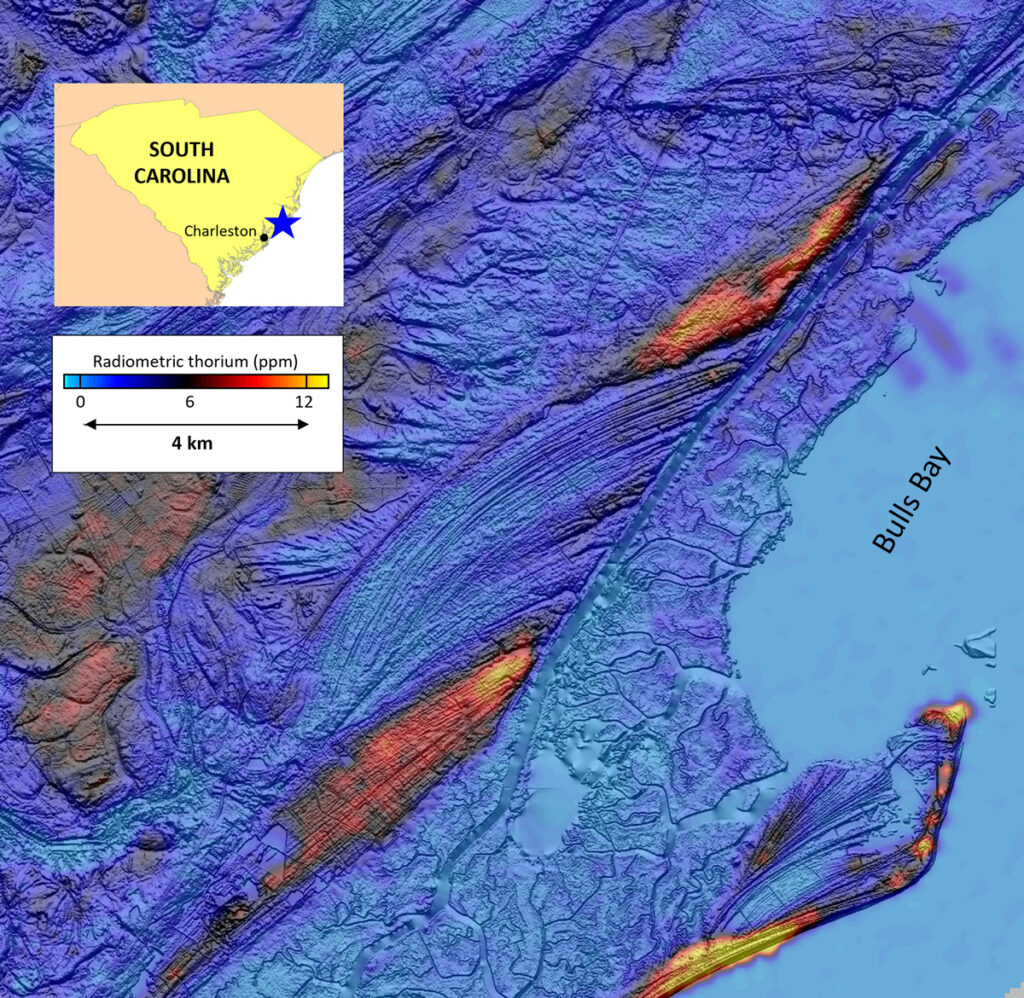
And over South Carolina’s Coastal Plain sediments, Shah et al. [2021] imaged heavy mineral sands containing critical commodities: REEs, titanium, and zirconium (Figure 3). These researchers are developing new constraints on critical mineral resource potential within individual geologic formations by evaluating the statistical properties of thorium anomalies.
Detecting Impacts from—and on—Humans
A new frontier in critical mineral studies focuses on the potential to tap unconventional resources, especially those present in mining waste and tailings.
A new frontier in critical mineral studies focuses on the potential to tap unconventional resources, especially those present in mining waste and tailings. Mining and mine waste features are scattered across the United States, sometimes presenting environmental or public health hazards. If critical minerals could be reclaimed economically from waste, proceeds could help to fund cleanup actions.
Early work with airborne data on this frontier focused, for example, on examining anomalous thorium concentrations in tailing piles from abandoned iron mines in the eastern Adirondack Highlands of upstate New York. Researchers found that the piles that contained REEs in the mineral apatite expressed thorium anomalies, whereas other piles were devoid of these critical commodities.
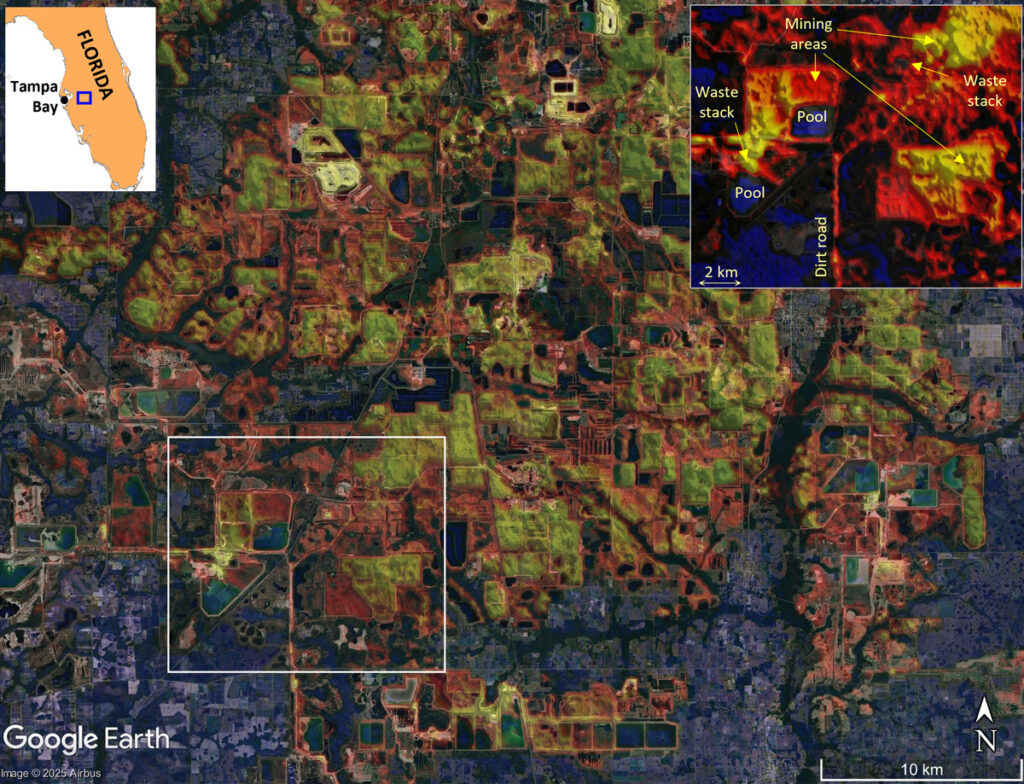
More recently, scientists identified uranium anomalies in datasets collected over stacks of phosphate mining waste, known as phosphogypsum stacks or “gypstacks,” in Florida (Figure 4). And data collected over coal mining waste sites in the Appalachian Mountains show elevated potassium, thorium, and uranium. Mine waste in both these areas is now being studied more closely as possible REE resources.
Radiometric surveys can also shed light on natural geologic hazards that affect human health. Radon gas, a well-known risk factor for lung cancer, is produced from the breakdown of radioelements, especially uranium, in soil and rock. By imaging areas with elevated uranium, radiometric surveys can delineate areas with higher radon risk.
In the 1980s, the U.S. Department of Energy commissioned a total-count survey over a small section of the Reading Prong in Pennsylvania, a geologic unit with known instances of uranium that also extends into New Jersey and New York, to map radon hazards. New Earth MRI datasets collected west of that part of Pennsylvania and elsewhere cover much larger areas and distinguish uranium, thorium, and potassium, providing a means for extensive radon risk evaluation.
Much More to Explore
Earth MRI airborne magnetic and radiometric surveys funded as of September 2025 have provided a roughly 18-fold increase in publicly available high-resolution radiometric data compared with what was available in 2018, and additional surveys are planned for 2026. However, the new total still represents only about 19% of the area of the United States (including Alaska, Hawaii, and Puerto Rico), so there is still a long way to go to achieve full national coverage.
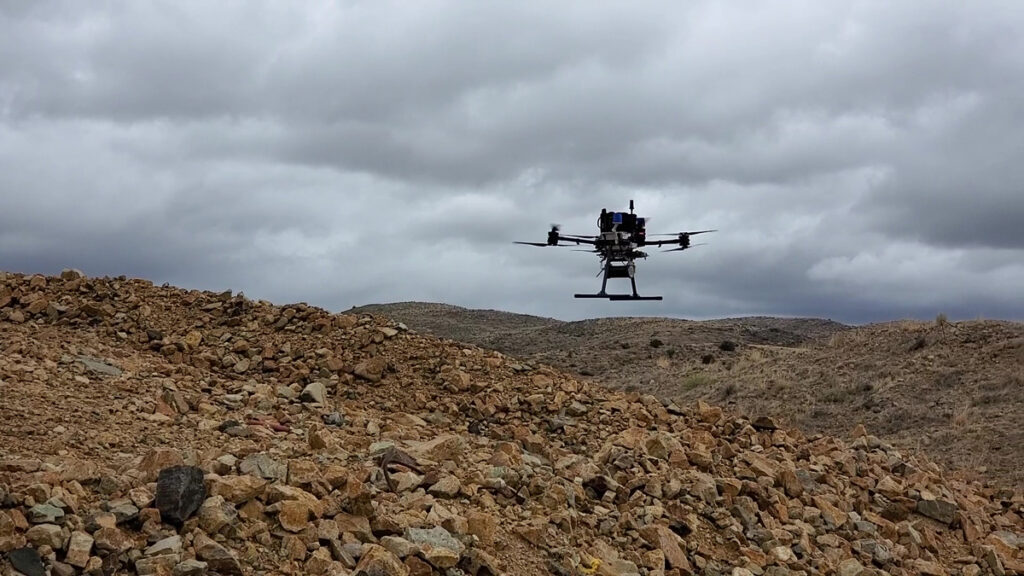
The new open-access data present a wide variety of opportunities for study, from qualitative revisions of geologic maps to quantitative analyses that address questions about critical mineral resources and other societally important topics. These data are also inspiring innovative approaches, such as drone-based surveys using new ultralightweight sensors that can provide unprecedented spatial resolution, with uses in detailed mine waste studies, radon evaluation, and other applications [e.g., Gustafson et al., 2024]. Another new approach combines airborne radiometric data with sample geochemical data to evaluate critical minerals in clays [Iza et al., 2018].
Other novel applications that encourage economic development, maintain national security, and enhance public safety are waiting to be developed and explored.
Acknowledgments
We thank Tom L. Pratt and Dylan C. Connell for helpful reviews. Any use of trade, firm, or product names is for descriptive purposes only and does not imply endorsement by the U.S. government.
References
Drenth, B. J., and V. J. S. Grauch (2019), Finding the gaps in America’s magnetic maps, Eos, 100, https://doi.org/10.1029/2019EO120449.
Duval, J. S. (1980), Radioactivity method, Geophysics, 45(11), 1,690–1,694, https://doi.org/10.1190/1.1441059.
Gustafson, C., et al. (2024), Mine waste identification and characterization using airborne and uncrewed aerial systems radiometric geophysical surveying, Geol. Soc. Am. Abstr. Programs, 56(5), 1-6, https://doi.org/10.1130/abs/2024AM-403640.
International Atomic Energy Agency (2003), Guidelines for Radioelement Mapping Using Gamma Ray Spectrometry Data, IAEA-TECDOC-1363, Vienna.
Iza, E. R. H. F., et al. (2018), Integration of geochemical and geophysical data to characterize and map lateritic regolith: An example in the Brazilian Amazon, Geochem. Geophys. Geosyst., 19(9), 3,254–3,271, https://doi.org/10.1029/2017GC007352.
Johnson, M. R., et al. (2019), Airborne geophysical survey inventory of the conterminous United States, Alaska, Hawaii, and Puerto Rico (ver. 4.0, April 2023), data release, U.S. Geol. Surv., Reston, Va., https://doi.org/10.5066/P9K8YTW1.
Magnin, B. P., Y. D. Kuiper, and E. D. Anderson (2023), Ediacaran-Ordovician magmatism and REE mineralization in the Wet Mountains, Colorado, USA: Implications for failed continental rifting, Tectonics, 42(4), e2022TC007674, https://doi.org/10.1029/2022TC007674.
Minty, B. (1997), Fundamentals of airborne gamma-ray spectrometry, AGSO J. Aust. Geol. Geophys., 17, 39–50.
Ponce, D. A., and K. M. Denton (2019), Airborne radiometric maps of Mountain Pass, California, U.S. Geol. Surv. Sci. Invest. Map, 3412-C, scale 1:62,500, https://doi.org/10.3133/sim3412C.
Shah, A. K., et al. (2021), Mapping critical minerals from the sky, GSA Today, 31(11), 4–10, https://doi.org/10.1130/GSATG512A.1.
Shives, R. B., B. W. Charbonneau, and K. L. Ford (2000), The detection of potassic alteration by gamma-ray spectrometry—Recognition of alteration related to mineralization, Geophysics, 65, 2,001–2,011, https://doi.org/10.1190/1.1444884.
Wang, C., et al. (2023), A recently discovered trachyte-hosted rare earth element-niobium-zirconium occurrence in northern Maine, USA, Econ. Geol., 118(1), 1–13, https://doi.org/10.5382/econgeo.4993.
Author Information
Anjana K. Shah ([email protected]), U.S. Geological Survey, Lakewood, Colo.; Daniel H. Doctor, U.S. Geological Survey, Reston, Va.; Chloe Gustafson, U.S. Geological Survey, Lakewood, Colo.; and Alan D. Pitts, U.S. Geological Survey, Reston, Va.