
Imagine driving an electric car past a solar farm that is spread across a Sun-drenched valley below a ridge of wind turbines. Or perhaps imagine changing a thermostat to cool or heat your home, knowing that the adjustment is not incrementally increasing greenhouse gas levels in the atmosphere. These are pictures of tranquility in a carbon-neutral future. But how do we make these visions reality on a broad scale?
Transitioning to carbon-neutral economies and lifestyles will require substantial sources of mineral commodities—not only the copper essential for the electrical grid and electric vehicles (EVs) but also a host of other metals that traditionally have not been the focus of mineral industry exploration or production. These metals are vital to meet supply chain needs for low-carbon vehicle, energy, and battery storage technologies, among other applications.
In the United States, many such mineral commodities—including the cobalt, nickel, lithium, manganese, germanium, gallium, indium, and graphite needed for EV batteries, solar panels, wind turbines, and energy storage—are imported. In some cases, supplier countries have histories of poor environmental, social, or governance practices—histories to which our increasing reliance and demand contribute.
To identify prospective areas that may host critical and other minerals, we need to better understand the geologic and metallogenic environment under our feet.
The United States does not entirely lack its own supplies of these less common metals. Many of the critical mineral commodities required for these technologies occur as by-products or coproducts in ores currently mined domestically for copper, lead, zinc, or gold. Where they have been found, however, they often have not been recovered because historical demand was not significant enough to create an economic market. In other instances, discoveries of critical minerals have occurred in jurisdictions where development is hindered by current regulations. And for the most part, individual ore bodies have historically not been analyzed to determine enrichment levels of less abundant minerals, so we lack sufficient data to effectively identify and target critical minerals.
To identify prospective areas that may host critical and other minerals, we need to better understand the geologic and metallogenic environment under our feet. That means we need new high-quality data, especially where few have been collected before.
In 2019, the U.S. Geological Survey (USGS), in partnership with the Association of American State Geologists and other federal, state, and private-sector organizations, initiated the Earth Mapping Resources Initiative (Earth MRI) to provide the high-quality data needed for evaluation of critical minerals. Earth MRI is guiding the selection of areas for new data acquisition by developing and implementing a mineral systems framework that holistically connects regional-scale geologic processes to the formation and preservation of mineral deposits. In its first few years, the effort has already helped scientists better grasp the country’s critical minerals landscape.
Potential Weak Links in Critical Supply Chains
Critical minerals are defined in the United States as nonfuel mineral commodities that are essential to economic or national security—for example, to wean our dependence on carbon fuels—and are subject to potential supply chain vulnerabilities. Mineral resources are not distributed evenly around the world, and we have historically depended on global sources for commodities that have not been sourced domestically. However, geopolitical issues and disruptions in global trade pose risks that can affect our ability to obtain critical minerals. Recognition of these potential risks by lawmakers led to federal legislation and executive orders directing the USGS to develop a list of critical minerals.
The initial list was released in 2018 and identified 35 critical minerals. In 2022, the list was expanded to 50 and updated to include individual rare earth elements (REEs) and platinum group elements as distinct critical minerals. (They were lumped as commodity groups on the 2018 list.) The United States is 100% dependent on imports for 21 of these critical mineral commodities, and it is at least 50% dependent on imports for another 28.
The U.S. Geological Survey is focused on producing new high-quality data sets that can be used for predictive prospectivity analyses detailing where, how, and why critical minerals occur within the country’s borders.
To decrease U.S. dependence on foreign supplies, domestic sources of critical minerals must be identified, discovered, permitted, produced, and processed. Domestic supplies of many critical minerals were produced previously, often during wartime with government support. Some, such as lithium and cobalt (needed for most EV batteries), are still mined in the United States, but only from one or two deposits; others, such as arsenic, tin, gallium, and scandium (needed for semiconductors and high-performance alloys), have not been mined domestically for more than 20 years. The paucity of past critical minerals exploration and production has resulted in the sparse and incomplete availability of modern geologic, geochemical, geophysical, and topographic data sets required to produce national mineral potential maps, thus hampering exploration of domestic mineral potential.
Through the Earth MRI program, with additional funding support included in the Bipartisan Infrastructure Law of 2021, the USGS is focused on producing new high-quality data sets that can be used for predictive prospectivity analyses detailing where, how, and why critical minerals occur within the country’s borders. Precompetitive data generated by state surveys and the USGS are freely provided to the public; the private sector has the task of exploring for, discovering, proving, and producing the resources, as well as developing domestic processing facilities and supply chains. As these efforts progress in tandem, the exploration and production of domestic sources become less economically risky.
A Mineral Systems Approach
Mineral systems involve “ingredients”—such as their geologic and tectonic setting, source rocks, and transport media (e.g., fluids) and pathways—required to generate ore deposits. The specific characteristics of these systems, which form over large time and space scales, can profoundly influence the type and abundance of accumulated metals. However, Earth systems comprise diverse and complicated processes, and the ingredients are not always mixed in ways ideally suited for generating economic ore deposits. Indeed, most mineral systems do not produce economic deposits. The challenge is to identify those systems that do and to understand which ingredients are key.
Focusing on the large footprints of entire mineral systems rather than the restricted footprints of individual ore deposits provides a more complete and integrated understanding of critical mineral sources (e.g., where elements originated) and sinks (e.g., where the elements are concentrated). Mapping these systems across the country results in footprints representing areas that might host critical mineral deposits because the essential ingredients have been identified, although such maps are not substitutes for mineral prospectivity or mineral resource maps that define the footprints most likely to contain mineralization.
A mineral systems framework developed for Earth MRI identified 23 types of mineral systems in the United States that potentially contain critical minerals. The USGS collaborated with state geological surveys to outline footprints of these mineral systems as focus areas where new data could inform the potential for critical minerals. More than 800 focus areas provide an initial, broad screening tool for prioritizing new data acquisition (Figure 1). Data characterizing the focus areas are available in geographic information system (GIS) mapping and analytic software [Dicken et al., 2022]. Explanations of why each area was selected (e.g., the ingredients identified) and information on known ore deposits, current or historical production, and estimated resources, as well as geological maps covering the area and more than 4,000 references, accompany the GIS data.

These data were used to generate a national map of focus areas for potential critical mineral resources in the United States [Hammarstrom et al., 2023]. Variability in the spatial scales of mineral system footprints shown in Figure 1 reflects the diversity of geologic processes that influence mineral deposits. Some mineral systems encapsulate paleodrainage basins that extend over thousands of square kilometers, whereas others are focused around small rock intrusions covering less than 5 square kilometers.
Differences in the scale of focus areas—and in the detail with which they are described—also reflect the availability of data and knowledge in given regions. Large focus areas depicted in remote regions of Alaska, for example, are based on sparse data in comparison with those depicted in historic or active mining districts in the western United States (Figure 1). Some focus areas include active exploration projects or historical mines with reported critical mineral production. When new geophysical or geochemical data or additional mapping become available in these regions with lower data coverage, focus areas can be reevaluated for their likelihood to host critical mineral deposits.
Data Acquisition Gets Underway
More than 100 Earth Mapping Resources Initiative–funded projects are underway across the country as state geological surveys have fanned out across focus areas.
Many mineral-rich regions of the country lack geologic, geochemical, and geophysical maps at the scales necessary to capture important components of mineral systems. More than 100 Earth MRI–funded projects are underway across the country as state geological surveys have fanned out across the focus areas to collect vital new geologic and geochemical data required to improve U.S. geologic base maps. In many cases, mineral systems cross state lines, leading to new cross-border collaborations among states.
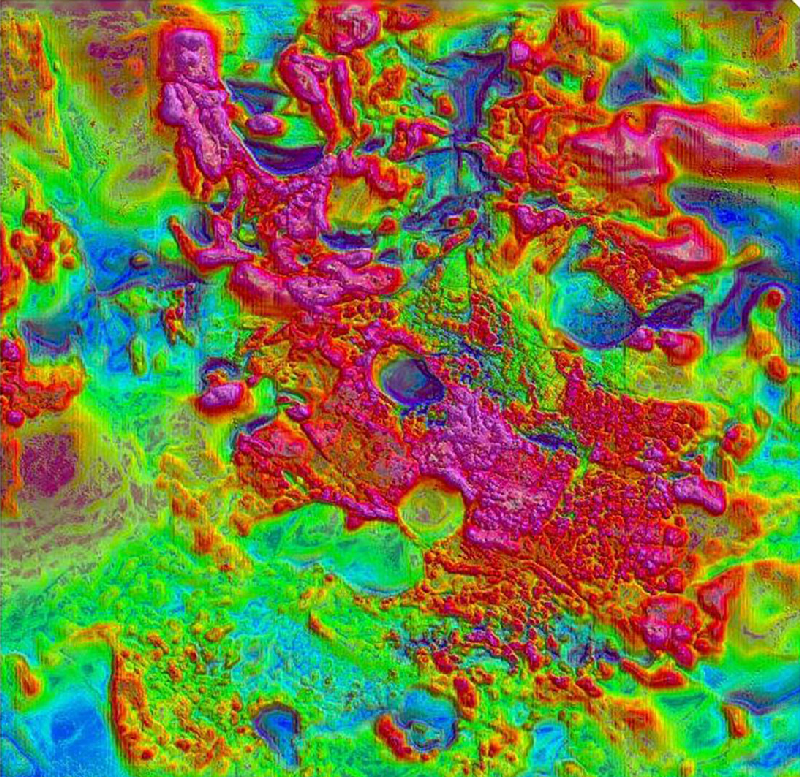
The USGS is working with states and other partners to design and acquire high-quality airborne magnetic, radiometric, and electromagnetic data to inform mineral resource surveys. Geophysical surveys are often flown preceding or early in the field efforts so the results can guide researchers on the ground to key areas that should be evaluated through mapping and geochemical sampling. Meanwhile, the USGS 3D Elevation Program is filling data gaps in the national lidar coverage to facilitate mapping and other studies.
The Bipartisan Infrastructure Law directs Earth MRI to provide integrated topographic, geologic, geochemical, and geophysical data; to complete initial comprehensive national modern surface and subsurface mapping and data integration; and to provide interpretation of subsurface and aboveground resources within 10 years. As a result, the USGS also created a new initiative that is collaborating with Earth MRI to inventory aboveground resources in abandoned mine lands and characterize near-mine aboveground resources as potential sources of critical minerals that were not previously recognized or recovered during past mining.
Early Results of the MRI
The earliest Earth MRI projects are already showing promising results. A project conducted in northern Maine during the first year of the program revealed a previously unrecognized REE-niobium-zirconium occurrence hosted in igneous trachyte rocks at Pennington Mountain [Wang et al., 2023]. This critical mineral occurrence was discovered thanks to a regional airborne radiometric and magnetics survey flown by Earth MRI that detected high concentrations of thorium and uranium, elements known to be associated with igneous rock types that can host REEs and other rare metals (e.g., niobium and zirconium). Subsequent fieldwork targeted these thorium and uranium anomalies for closer study. A detailed ground radiometric survey combined with portable X-ray fluorescence and whole-rock analyses of representative rock samples confirmed the presence of REE and other critical mineral enrichment over a roughly 1.2-square-kilometer area, with stronger localized mineralization [Wang et al., 2023].
Airborne geophysical surveys over a vast portion of the U.S. Atlantic Coastal Plain have highlighted the potential for titanium, zircon, and REE enrichments in heavy mineral sands in the coastal environment [Shah et al., 2021]. This research has also elucidated complex but poorly understood shoreline processes, including how heavy minerals derived from Virginia’s Piedmont terrane and delivered offshore by major rivers are subsequently transported along the coast via longshore currents and then redeposited and concentrated onshore.
Earth MRI projects in Illinois and Kentucky have combined airborne magnetic and radiometric surveys with detailed geologic maps of the mineral-rich Illinois-Kentucky Fluorspar District and Hicks Dome areas. The interdisciplinary work has provided new data on this important peralkaline REE system, which has seen past production of critical minerals (barium and fluorine) and is known to host critical minerals such as light REEs, yttrium, titanium, niobium, and beryllium. It has also improved understanding of seismic hazards in this earthquake-generating region by providing new constraints on the location and style of faulting through detailed mapping [Denny and Kershaw, 2021; Denny et al., 2020; Lukoczki et al., 2022; McCafferty and Brown, 2020; McCafferty and Connell, 2022].
Meanwhile, work in the Yukon-Tanana terrane of interior Alaska has focused on how precursor tectonic terranes influence the geochemistry and metallogeny of younger magmatic hydrothermal mineral systems and subsequent deposits. Kreiner et al. [2019] showed that contrasts in rock characteristics in two structurally juxtaposed terranes influenced the metals concentrated in the ores in each terrane. As a result of these contrasts, porphyry copper systems of the Yukon-Tanana terrane are enriched in molybdenum, tungsten, and rhenium, whereas adjacent ancestral North American basement terrane hosts porphyry copper systems enriched in bismuth, arsenic, and gold.
Earth MRI has almost doubled the amount of high-quality magnetic data available for the conterminous United States and quadrupled the amount for Alaska.
To date, Earth MRI has almost doubled the amount of high-quality magnetic data available for the conterminous United States and quadrupled the amount for Alaska. In addition to their use in mapping critical mineral resources, the mapping, geophysical, and lidar data collected as part of Earth MRI are helping researchers characterize geothermal energy and water resources and delineate areas prone to landslide, earthquake, and flooding hazards.
The Path Ahead for Earth MRI
The path to securing domestic critical mineral supply chains will be long and winding. How far we make it down the path depends largely on significant challenges related to resource development and processing. These challenges include the availability of land where the resources exist, the environmental impacts and societal acceptance of resource extraction, and the time frames for developing and permitting mines. Decisions made with respect to these issues will have far-reaching effects on the country’s ability to transition successfully to carbon-neutral energy sources.
Before we can face these decisions, however, we need to know where and which critical minerals can be sourced domestically to meet the country’s needs. That is where Earth MRI’s present and future efforts come in, providing precompetitive multidisciplinary data to the government and private sectors.
Plans are underway to make the newly acquired data available in analysis-ready formats through an online portal. These data are essential for developing mineral potential maps of large mineral systems and for subsequent resource assessments performed in collaboration with the USGS Mineral Resources Program. Figure 2 shows the different types of Earth MRI data sets that can be integrated for a study area such as the Yukon-Tanana upland of eastern Alaska, for example.

Our long-term goal for Earth MRI is to develop the capability for seamlessly integrating new data and updating mineral potential maps showing where critical commodities are known or suspected to occur in mineral deposits (Figure 2) and mine wastes. We are also exploring ways to incorporate machine learning and artificial intelligence to facilitate efficient integration and analysis of large data sets. Further, we are collaborating with international colleagues to develop the important criteria that define mappable mineral systems. Once they are defined, these criteria can be incorporated into models to produce higher-quality mineral resource maps both within and outside the United States.
The resulting maps will be the product of years of data acquisition; database design; mineral systems framework development; and collaboration at state, national, and international scales. And they will put us on the path to pursue the goals of the low-carbon energy transition.
Acknowledgments
Any use of trade, firm, or product names is for descriptive purposes only and does not imply endorsement by the U.S. government.
References
Denny, F. B., and C. T. Kershaw (2021), Bedrock geology of Hicks Dome, Hardin and Pope Counties, Illinois, Illinois County Geologic Map, EMRI Hicks Dome-BG, 2 sheets, scale 1:12,000, USGS-EMRI contract report, 145 pp., Ill. State Geol. Surv., Champaign.
Denny, F. B., et al. (2020), Mines in the Illinois portion of the Illinois-Kentucky Fluorspar District, Circ. Ill. State Geol. Surv., 604, 73 pp., experts.illinois.edu/en/publications/mines-in-the-illinois-portion-of-the-illinois-kentucky-fluorspar–2.
Dicken, C. L., et al. (2022), GIS, supplemental data table, and references for focus areas of potential domestic resources of critical minerals and related commodities in the United States and Puerto Rico, data release, U.S. Geol. Surv., Reston, Va., https://doi.org/10.5066/P9DIZ9N8.
Hammarstrom, J. M., et al. (2023), National map of focus areas for potential critical mineral resources in the United States, U.S. Geol. Surv. Fact Sheet, 2023-3007, 4 pp., https://doi.org/10.3133/fs20233007.
Kreiner, D. C., et al. (2019), Links between tectonics, magmatism, and mineralization in the formation of Late Cretaceous porphyry systems in the Yukon-Tanana upland, eastern Alaska, USA, paper presented at 15th Biennial Meeting, Soc. for Geol. Applied to Miner. Deposits, Edinburgh, U.K.
Lukoczki, G., et al. (2022), Phase I activities of the Earth Mapping Resources Initiative (Earth MRI) in the western Kentucky Fluorspar District, Ky. Geol. Surv. Rep. Invest., 66.
McCafferty, A. E., and P. J. Brown (2020), Airborne magnetic and radiometric survey, southeastern Illinois, western Kentucky, and southern Indiana, 2019, data release, U.S. Geol. Surv., Reston, Va., https://doi.org/10.5066/P9R05B0M.
McCafferty, A. E., and D. M. Connell (2022), Airborne horizontal-magnetic gradient and radiometric survey over parts of southeast Missouri, southern Illinois and western Kentucky – The Gap survey, 2021, data release, U.S. Geol. Surv., Reston, Va., https://doi.org/10.5066/P9TK8KMM.
Shah, A. K., et al. (2021), Mapping critical minerals from the sky, GSA Today, 31(11), 4–10, https://doi.org/10.1130/GSATG512A.1
Wang, W., et al. (2023), A recently discovered trachyte-hosted rare earth element-niobium-zirconium occurrence in northern Maine, USA, Econ. Geol., 118, 1–13, https://doi.org/10.5382/econgeo.4993.
Author Information
Douglas C. Kreiner ([email protected]), U.S. Geological Survey, Anchorage, Alaska; Jane Hammarstrom, U.S. Geological Survey, Reston, Va.; and Warren Day, U.S. Geological Survey, Golden, Colo.