Students, especially those at the beginner levels, are often presented with simplistic visualizations of plate tectonics that lack the rich detail and recent science available to researchers. Yet plate tectonics’ ability to explain fine details of the continental and oceanic lithosphere is the strongest available verification of this theory. Presenting more of this detail in a real-world setting can help motivate students to study the processes that mold Earth’s oceans and continents.
Google Earth allows instructors and students to explore Earth’s oceans and continents in considerable detail. The images in this open access, online resource provide a striking portrait of the planet’s continents and oceans. A user can browse this virtual globe’s features and explore in fine detail mountain ranges, geological faults, ocean basins, and much more.
Properly annotated, Google Earth can also provide insights into the geophysical processes that created the world as we see it today. It can serve as an informative tool for students and instructors in their study of tectonic plates, bringing to life the geological significance of features such as the famous Ring of Fire that girdles the Pacific.
Our project, Google Earth for Onsite and Distance Education (GEODE), has now added a Grand Tour of the Ocean Basins to its website to provide such help. This tour gives instructors a way to become familiar with details of Earth’s tectonic story and to stay up to date about new insights into tectonic processes. They can then better respond to, and provide context for, on-the-spot questions from students as they become caught up in the images they view on Google Earth.
The tour was designed for geoscience majors, but an instructor could edit it to suit general education or high school courses.
The tour was designed for geoscience majors, but an instructor could edit it to suit general education or high school courses. Students can use the documentation as a self-study tool, even if they do not have extensive prior knowledge of tectonic processes.
A Teaching Sequence
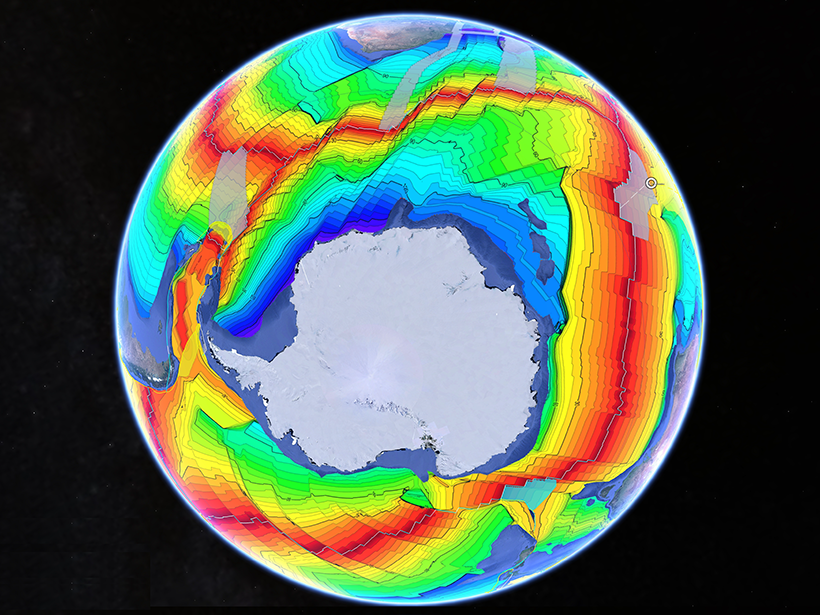
The tour is organized in a teaching sequence, beginning with the East African Rift, continuing through the Red Sea and Gulf of Aden into the Arabian Sea. The tour proceeds to the passive margins of Antarctica, which lead tourists to the South Atlantic, North Atlantic, and Arctic oceans. En route, students visit thinned continental shelves and abandoned ocean basins (where seafloor spreading no longer occurs). The Lesser Antilles Arc and Scotia Arc serve as an introduction to Pacific continental arcs, transform boundaries, island arcs, and marginal basins. The tour ends with ophiolites—slivers of ocean thrust onto land—in Oman.
The tour uses a series of Google Earth placemarks (map pin icons), with descriptions and illustrations in a separate Portable Document Format (PDF) file. We provide plate tectonic context by combining two superlative resources: ocean floor ages from the Age of the Lithosphere for Google Earth website (based on Müller et al. [2008]) and the plate boundary model from Laurel Goodell’s Science Education Resource Center page (based on Bird [2003]).
Not Your Grandmother’s Plate Tectonics
Our virtual tour of ocean basins includes lots of up-to-date local details, thanks largely to recent research that takes advantage of precise data provided by satellite-based GPS. Just as your car’s GPS receiver tells you how fast you are traveling and in what direction, highly sensitive GPS devices record plate velocities, even though plates move only at about the rate your fingernails grow. Researchers no longer regard plates as absolutely rigid: Internal plate deformation was first documented in the Indian Ocean [Wiens et al., 1985].
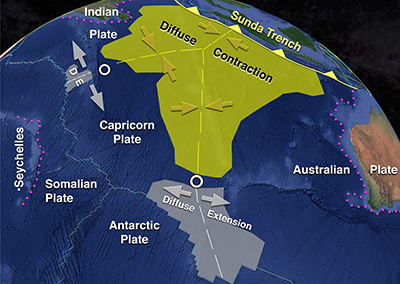
GPS surveys and seismic records reveal large regions of deformation along diffuse boundaries between tectonic plates, where the movement is not along one well-defined plane. Instead, movement involves microplates: relatively rigid parts of plates that move with significantly differing velocities. For example, tour stop 9, the eastern Indian Ocean, shows the presence of widespread diffuse deformation in the Indian, Australian, and Capricorn plates (Figure 1). For mechanical reasons, these microplates tend to pivot about points separating regions of diffuse extension from compression, represented by white circle icons in the Google Earth tour.
Beyond Atlantic Style and Pacific Style
Our tour allows us to address misconceptions about the boundaries between tectonic plates and between oceans and continents.
Our Google Earth tour also allows us to address misconceptions about the boundaries between tectonic plates and between oceans and continents. Some of the most persistent misconceptions concern the differences between active plate boundaries and passive continental margins.
A bit of background first: Active plate boundaries can be divergent (mid-ocean ridges), convergent (subduction and collision zones), or transform (e.g., the San Andreas Fault). At passive continental margins, oceanic lithosphere and continental lithosphere are welded together along the fossilized line of initial continental rifting. A person in our Google Earth tour will encounter numerous examples of both active plate boundaries and passive continental margins.
Misconceptions arise from the introductory level on, where teachers present students with two basic cross sections of ocean basins: Atlantic style with two passive continental margins and Pacific style with two active plate boundaries. Students commonly draw cross sections with two symmetrical active convergent plate boundaries even though there is no such ocean basin on Earth.
Symmetrical passive margins do exist, however: They border large regions of oceanic crust, including, for example, the North and South Atlantic oceans, the western portion of the Indian Ocean within the Arabian Sea, and the Southern Ocean between Australia and Antarctica as well as between Africa and Antarctica. But active basins are always asymmetrical, with ridges often far from the middle of the ocean basin. Seafloor spreading is generally symmetrical about ocean ridges (except for local instances of ridge jump), but there is no reason for subduction to occur at the same rate on either side of an ocean basin; hence, ridges migrate as they spread, and in places, they reach a trench and are subducted.
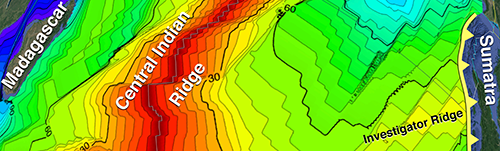
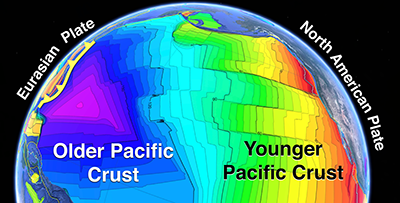
Our grand tour presents lithospheric cross sections of the Pacific crust to scale, with its eastern 4,000-kilometer-wide Nazca Plate and western 12,000-kilometer-wide Pacific Plate. It also highlights the eastern Indian Ocean, with its passive margin against Madagascar and active plate boundary against Burma-Sumatra, the scene of the devastating, tsunami-generating earthquake of 26 December 2004 (Figure 2).
This combination of passive continental margin and active plate boundary serves as a good modern analogue for the Iapetus Ocean, the ocean that separated paleo–North America from paleo-Europe and paleo-Africa before the collisions that created the Appalachians, Caledonides, and associated mountains. Models of those mountain-building events involve a collision of active and passive sides of the ocean basin at times as Iapetus was consumed.
Sampling Diversity in Ocean Basins
The grand tour also visits many of the diverse features of Earth’s ocean basins. A significant amount of oceanic crust resides in failed or abandoned basins bounded by passive margins. Such regions include the Gulf of Mexico, the Labrador Sea and Baffin Bay between Canada and Greenland, the Bay of Biscay between France and Spain, the western Mediterranean, and the Tasman and Coral seas east of Australia, all of which are visited on the tour.
Many offshore regions are underlain by oceanic crust that developed in marginal basins behind island arcs such as Japan and the Mariana Islands, and the tour visits these regions as well. Because the west side of the Pacific’s oceanic crust is so much older than the east, it is colder and denser and subducts steeply and rapidly. Consequently, trenches marking the initiation of subduction roll back eastward, like a Michael Jackson moonwalk. The resultant “trench suction” forces open multiple back-arc basins to the west of the main Pacific basin, with their own miniature spreading ridges.
A third type of minor ocean basin is created by side-stepping transform fault arrays as in the Gulf of California and on the northern border of the Caribbean Plate. In such locations, transform faults are long, and spreading ridge segments are short.
Finally, there are numerous oceanic plateaus with relatively thick crust derived from large igneous provinces or small submerged continental fragments. Examples of all of the above are included in our tour.
Triple Junctions and Hot Spots
The tour makes stops at triple junctions, where three major plates meet. At some locations, triangular microplates without any bounding continental margins grow, as exemplified by the Galápagos Microplate (Figure 3, tour stop 38). Researchers have found strong evidence that one such paleomicroplate grew to become the Pacific Plate (Figure 4) [Boschman and van Hinsbergen, 2016]. The Pacific oceanic crust never had passive continental margins. It was born at sea!

Oceans are also home to mantle hot spot trails unrelated to plate boundaries. The grand tour visits the well-known Hawaiian Islands–Emperor Seamount trail. Numerous other trails are easily recognizable in Google Earth.
File Formats and System Requirements
The tour is presented in two file formats: Keyhole Markup Language (KML)—the format of Google Earth custom content—and an associated PDF file. Google Earth puts descriptive text and imagery into placemark balloons, which can obscure the surface of the map. Because these balloons cannot be dragged to one side, simultaneous viewing of KML maps and PDF descriptive documents is the solution. Dual monitors, twin projectors, or pairs of laptops make for the best viewing for personal study, lecture presentation, and student collaboration.
Instructors may omit or rearrange tour stops to suit the needs of their courses.
The PDF document is laid out in frames suited to reading on digital devices. Each frame contains a block of text and associated imagery. Instructors may omit or rearrange tour stops to suit the needs of their courses. Because KML is human-readable, such rearrangements can be done in a text editor. Note that the KML file must be viewed on a desktop or laptop computer (Mac, Windows, or Linux) because Google Earth for mobile devices is highly limited.
Trying It Out for Yourself
The KML and PDF files are available for download. The KML download contains a simple network link to an online KML document so that updates occur automatically whenever the document is opened in Google Earth.
The author invites suggestions for continuously improving this resource.
Acknowledgments
Development was supported by the National Science Foundation under grant NSF DUE 1323419, “Google Earth for Onsite and Distance Education (GEODE).” Any opinions, findings, and conclusions or recommendations are those of the author and do not necessarily reflect the views of the National Science Foundation. Thanks are owed to the Eos editors and to two anonymous reviewers for very helpful suggestions that improved the submitted manuscript.
References
Bird, P. (2003), An updated digital model of plate boundaries, Geochem. Geophys. Geosyst., 4(3), 1027, https://doi.org/10.1029/2001GC000252.
Boschman, L. M., and D. J. J. van Hinsbergen (2016), On the enigmatic birth of the Pacific Plate within the Panthalassa Ocean, Sci. Adv., 2(7), e1600022, https://doi.org/10.1126/sciadv.1600022.
Müller, R. D., et al. (2008), Age, spreading rates, and spreading asymmetry of the world’s ocean crust, Geochem. Geophys. Geosyst., 9, Q04006, https://doi.org/10.1029/2007GC001743.
Royer, J.-Y., and R. G. Gordon (1997), The motion and boundary between the Capricorn and Australian plates, Science, 277(5330), 1268–1274, https://doi.org/10.1126/science.277.5330.1268.
Schouten, H., et al. (2008), Cracking of lithosphere north of the Galapagos triple junction, Geology, 36(5), 339–342, https://doi.org/10.1130/G24431A.1.
Wiens, D. A., et al. (1985), A diffuse plate boundary model for Indian Ocean tectonics, Geophys. Res. Lett., 12(7), 429–432, https://doi.org/10.1029/GL012i007p00429.
Author Information
Declan G. De Paor (email: [email protected]), Department of Physics, Old Dominion University, Norfolk, Va., retired
Citation:
De Paor, D. G. (2017), A grand tour of the ocean basins, Eos, 98, https://doi.org/10.1029/2017EO081093. Published on 01 September 2017.
Text © 2017. The authors. CC BY-NC-ND 3.0
Except where otherwise noted, images are subject to copyright. Any reuse without express permission from the copyright owner is prohibited.