Source: Water Resources Research
As Earth’s growing population increasingly stresses global freshwater supplies, there is mounting pressure to more efficiently manage this crucial resource. This pressure is particularly true in the agricultural sector, which consumes more than two thirds of the water withdrawn from our planet’s lakes, rivers, and aquifers.
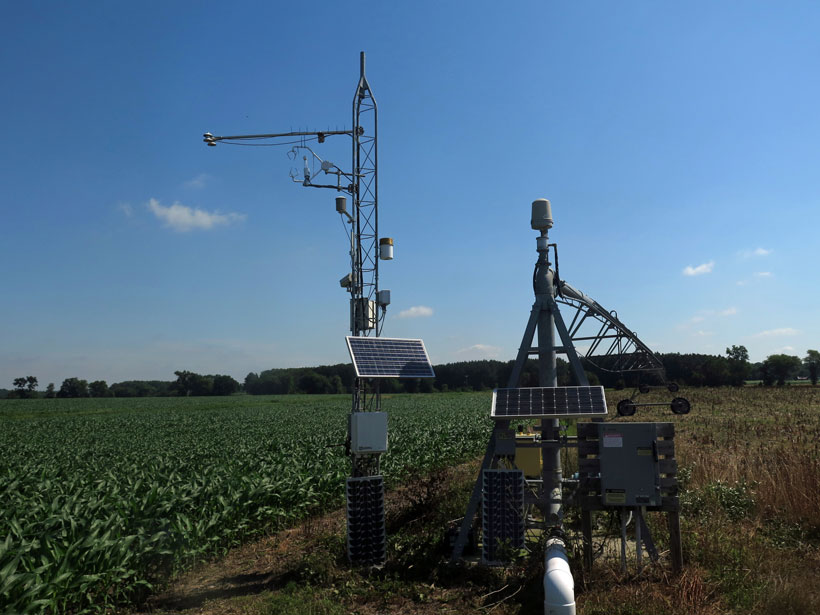
Irrigation methods that maximize water uptake by crops (transpiration) while minimizing the “wasted” amount that evaporates from the soil generally improve the efficiency of agricultural water use. The ability to remotely and frequently monitor these processes at field scales would therefore benefit improving water use efficiencies worldwide. To date, however, no individual satellite system is capable of providing all of this information at the desired scale. The Landsat satellites, for example, offer excellent spatial resolution, but their measurements are too sparse in time, whereas satellites with much more frequent sampling intervals, like the Moderate Resolution Imaging Spectroradiometer (MODIS), have a resolution too coarse to monitor individual fields.
Now Sun et al. have developed a novel method that merges the best attributes of both satellite systems. Their “data fusion” technique combines images acquired from multiple satellites with varying temporal and spatial resolutions together with standard meteorological data to create daily evapotranspiration (ET) maps with a resolution of 30 meters.

To test the accuracy of these water use maps, the researchers applied this technique to the Choptank River watershed in Maryland’s portion of Chesapeake Bay. The results, which span 2013 to 2014, indicate the new maps are a considerable improvement over standard interpolation methods, reducing the relative error in daily ET estimates from 27% to 18% and offering substantial improvement at daily and seasonal timescales. The team was able to discern spatial differences, including higher ET rates closer to the bay, as well as to estimate both soil evaporation and crop transpiration rates for different types of crops planted in the area.
This technique, which is applicable to most of the world’s major agricultural regions, represents an important technological advance. To fully harness its potential, the team is now working to integrate the fused data sets into hydrologic models to improve assessments of water quality in the Chesapeake Bay and improve the management of water around the globe. (Water Resources Research, https://doi.org/10.1002/2017WR020700, 2017)
—Terri Cook, Freelance Writer
Citation:
Cook, T. (2017), Blending satellite data to monitor agricultural water use, Eos, 98, https://doi.org/10.1029/2017EO078853. Published on 08 August 2017.
Text © 2017. The authors. CC BY-NC-ND 3.0
Except where otherwise noted, images are subject to copyright. Any reuse without express permission from the copyright owner is prohibited.