
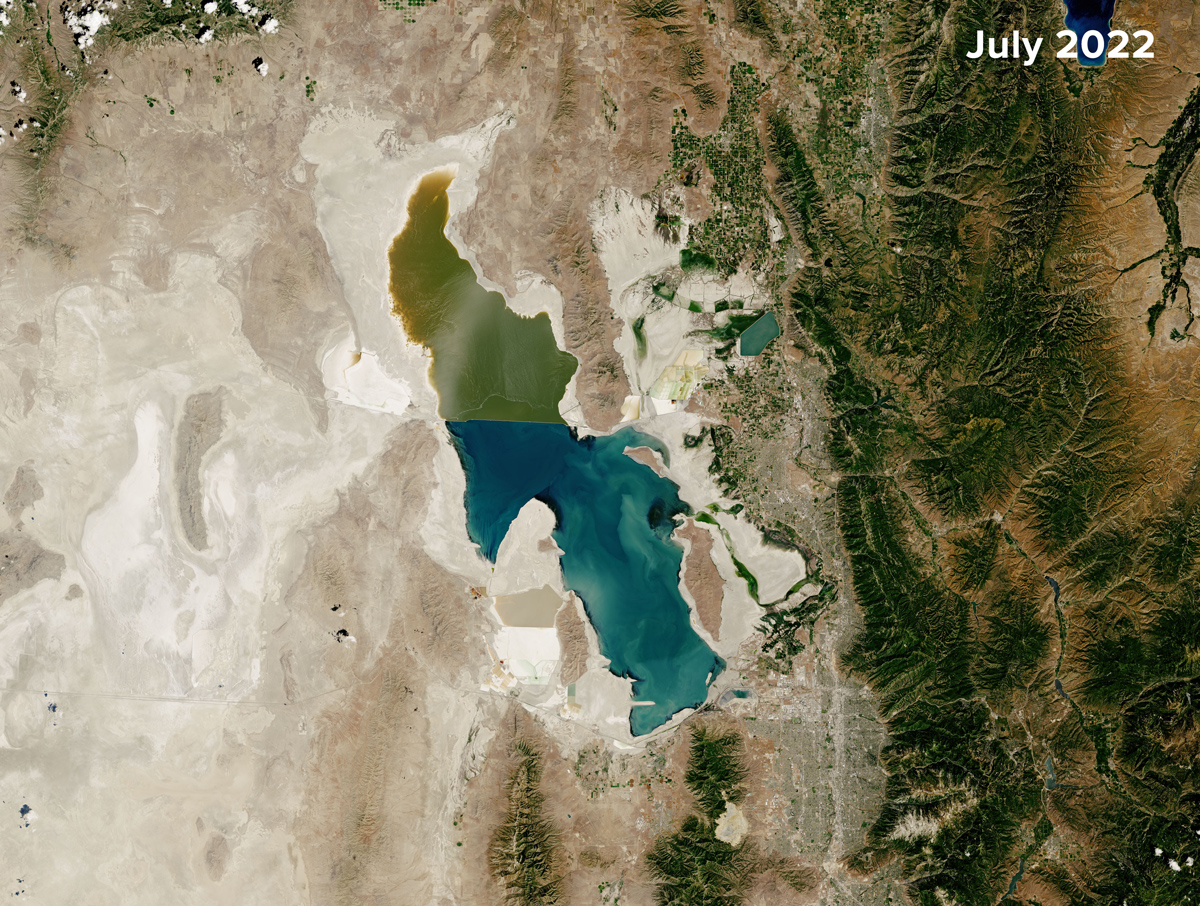
The Great Salt Lake is disappearing. Driven by decades of water diversions for agriculture, development, and mining, as well as by the warming climate, Utah’s famed lake has lost roughly 73% of its volume since 1850, exposing more than 54% of the lake bed.
The ecological and economic consequences of this decline are well documented, with the latter estimated at more than $2 billion in annual losses.
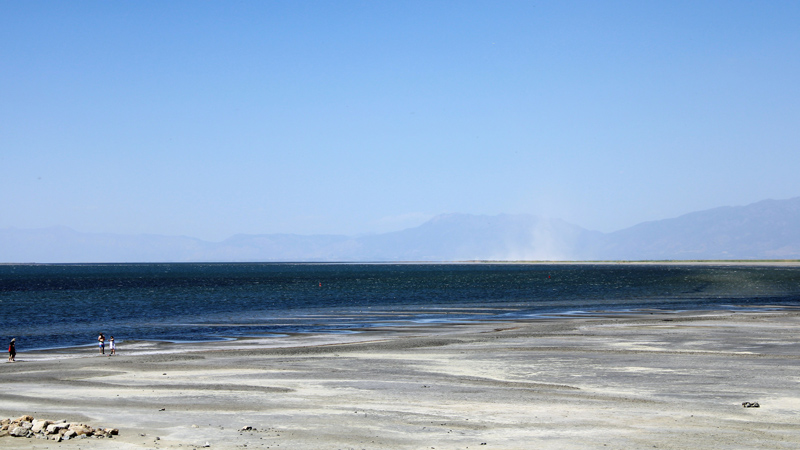
But a more insidious crisis is also rising as the lake vanishes: Dust from the exposed lake bed, picked up and blown by the wind, appears to be having a measurable mental health impact on the state’s residents.
Our recent research established a desiccated lake–to–mental health pathway, linking declining Great Salt Lake water levels to increased concentrations of hazardous, fine-grained particulate matter (PM2.5) in the air and, ultimately, to a higher prevalence of major depressive episodes (MDEs). In this context, lake desiccation acts as a potent threat multiplier. It does not merely create a new environmental hazard; it compounds existing social vulnerabilities, transforming a hydrological crisis into a chronic public health burden.

Previous studies documented important parts of this pathway separately, including links between drying lakes and dust or degraded air quality, and broader associations between PM2.5 exposure and mental health outcomes. Our study brought those links together by analyzing and combining information from various open-access, long-standing datasets collected by different agencies to study changing mental health conditions in Utah between 2006 and 2018.
This integration required more than data assembly. It also required a fundamental shift in how scientists from different fields framed the problem and spoke to one another.
The Friction of Interdisciplinary Collaboration
We had to assemble a research team representing a variety of specializations. Once the team formed, we faced immediate barriers regarding language and standards of evidence.
Our study began with a bold hypothesis: Air pollution from the Great Salt Lake might be affecting both physical and mental health. To investigate this idea, we had to assemble a research team representing a variety of specializations across hydrology, atmospheric science, and mental health—a challenging task considering some potential collaborators indicated they thought the research was too speculative or too far outside conventional disciplinary boundaries to pursue.
Once the team formed, we faced immediate barriers regarding language and standards of evidence. An early challenge involved weighing how different disciplines frame the concept of “ground truth.” In the geosciences, ground truth often refers to calibrated physical measurements from, say, a lake gauge, a monitoring station, or a satellite-validated observation. In mental health research, the evidence base often relies on self-reported symptoms, survey-derived prevalence estimates, and clinical interpretations. Bridging those traditions required trust and a shared understanding that no single dataset could capture the full picture.
We also had to reconcile the ways different disciplines consider a phenomenon’s time frame and impact. Physical scientists are trained to notice anomalies, such as sharp spikes in PM2.5 levels and abrupt departures from recognized patterns in climatology. But depression and other mental health disorders are rarely explained by a single environmental event. More often, depression emerges in the context of multiple events and experiences in someone’s life, as well as of genetic vulnerabilities and epigenetic influences. That understanding led us away from focusing only on short-lived pollution extremes and toward metrics that better captured sustained exposures from multiple environmental factors.
A third challenge involved scale. We had to harmonize high-resolution environmental observations with mental health estimates available only at broad geographic and temporal scales (because public health data are necessarily aggregated and deidentified to protect privacy). This integration forced us to consider what kinds of comparisons we could make responsibly and what kinds of claims the data could genuinely support.
Overcoming these research challenges shaped our study in fundamental ways. Geoscientists are accustomed to looking at environmental variables as direct drivers of change, hence the framing of our initial hypothesis. In public health, however, causality is notoriously difficult to prove when multiple confounding variables from socioeconomic status to personal medical history are at play.
We thus reframed our entire approach to address the question of whether an ecological relationship plausibly exists between pollution and depression based on ecosocial models and data on mental illnesses.
This reframing wasn’t just semantic; it changed our analytical methodology. For example, instead of using simple tests of direct cause-and-effect relationships, we needed statistical approaches that could evaluate grouped differences, main effects, and interaction effects across multiple datasets. For this, we used analysis of variance models to test whether social vulnerability modified the relationship between PM2.5 exposure and major depressive episodes—in other words, whether the same pollution burden translated into different mental health outcomes in counties with different levels of vulnerability.
Reconciling Incompatible Data
The technical backbone of our study involved merging massive public datasets representing several fields of study:
- Hydrology: daily lake level and volume measurements at Great Salt Lake collected by the U.S. Geological Survey (USGS)
- Atmospheric science: daily EPA measurements of PM2.5 concentrations collected by ground stations across each county in Utah, as well as monthly PM2.5 data from NASA’s MERRA-2 (Modern-Era Retrospective Analysis for Research and Applications, version 2) reanalysis product to isolate the contribution to overall PM2.5 levels of Great Salt Lake–derived dust
- Sociology: the Centers for Disease Control and Prevention (CDC) Social Vulnerability Index (SVI), a county-level measure released biennially that summarizes community vulnerability to external stressors on the basis of factors such as poverty, disability, minority status, housing, and transportation access
- Mental health: annual, deidentified records of MDE prevalence from the Substance Abuse and Mental Health Services Administration (SAMHSA) harmonized in our analysis to the county level
Figuring out how to use these datasets together presented a significant hurdle because they were never designed to be interoperable.
Figuring out how to use these datasets together presented a significant hurdle because they were never designed to be interoperable and because of temporal and spatial measurement gaps in the datasets. Raw, daily data on fluctuating PM2.5 levels do not easily map onto representations of mental health trends in annual surveys, especially the slow-burning, cumulative experiences of depressive episodes.
We used multiple approaches to solve this incompatibility problem.
We screened the EPA station records of PM2.5 and the MERRA-2 time series for statistical outliers using Z scores. This screening filters out extreme contributions to PM2.5 pollution, such as wildfire-driven spikes, to ensure that any correlations between pollution and MDEs reflected chronic exposure to lake desiccation–derived dust rather than to temporary anomalies.
We also moved beyond raw particulate concentration data and identified a pollution metric that reflects harm to humans. We looked to two key regulatory benchmark thresholds that are based on extensive scientific evidence linking PM2.5 exposure to serious respiratory and cardiovascular health risks: the EPA’s National Ambient Air Quality Standards 24-hour PM2.5 standard of 35 micrograms per cubic meter and the World Health Organization’s more stringent 24-hour guideline of 15 micrograms per cubic meter. (These thresholds are not specific to mental health outcomes, a gap that points to the need for future work evaluating mental health–relevant PM2.5 thresholds more directly.)
By applying these thresholds to the daily PM2.5 data, we determined the number of exceedance days—days during which the 24-hour average exceeded these safety limits—on a county-by-county basis. This metric allowed us to quantify annual county-level doses of exceedance days. It also created a common denominator with the health surveys, making it possible to statistically compare the occurrence of high dust levels resulting from environmental degradation of the Great Salt Lake to population-level mental health outcomes.
Detailing a Dose-Response Relationship
The results of our study revealed a concerning dose-response relationship. Mental health outcomes in our analysis came from grouped county-level SAMHSA estimates of MDE prevalence, which we analyzed and classified into five categories of severity ranging from “very low” to “very high.” We found that higher MDE categories were associated with exposure to more PM2.5 exceedance days. Annual average exceedance days rose from about 9.7 days for the very low MDE group to about 21.7 days for the very high group. Seasonal effects were also apparent, with average exceedance days for those in the high MDE group in winter exceeding 35 days.
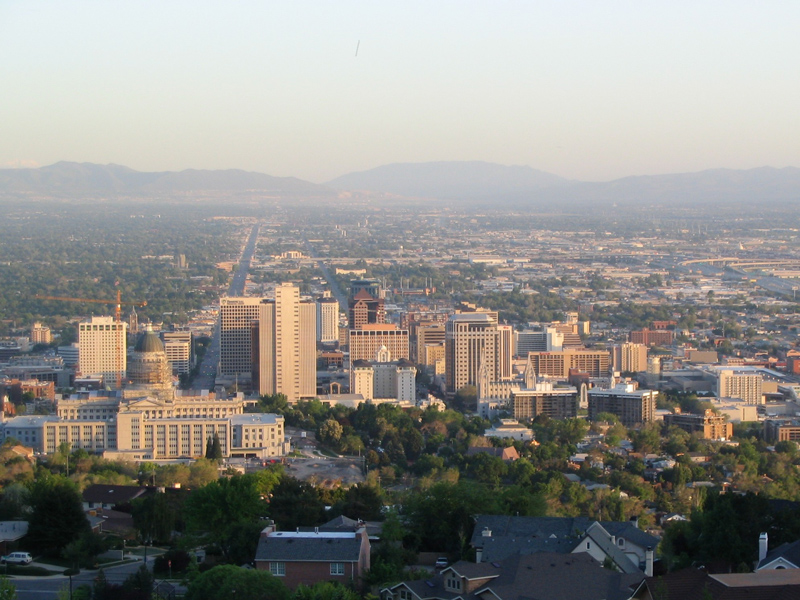
The frequency of high-pollution exceedance days was highest in Salt Lake County, which is home to Salt Lake City and more than 1.2 million people and lies directly downwind of Great Salt Lake. Duchesne County, farther east but also notably downwind, also had a high frequency of exceedance days.
In many cities, socioeconomic vulnerability is a strong predictor of an area’s pollution exposure. In Utah, looking at a natural rather than human-made source of pollution, we found the opposite.
Another important finding challenged a traditional environmental justice assumption. In many cities, socioeconomic vulnerability—as gauged by the SVI, for example—is a strong predictor of an area’s pollution exposure because lower-income neighborhoods are often located near industrial centers, transportation corridors, and other emissions sources. In Utah, looking at a natural rather than human-made source of pollution, we found the opposite: The most socially vulnerable counties, such as rural San Juan County in the state’s southeast, saw the lowest PM2.5 exposures because they are far from the lake bed.
Yet social vulnerability still mattered. Our interaction model revealed that social vulnerability significantly modified how exposure to PM2.5 lake dust related to mental health outcomes. In plain terms, the model tested whether the relationship between PM2.5 exceedance days and county-level prevalence of MDEs was the same across counties with different levels of social vulnerability.
Although social vulnerability by itself did not directly affect MDE prevalence to a significant extent, it significantly modified the PM2.5-MDE relationship, indicating that for a given level of pollution exposure, more socially vulnerable counties experienced a disproportionately higher prevalence of MDEs. This trend may arise because these populations have less access to protective buffers that shield against dust exposure and its effects, such as high-efficiency air filtration, stable housing, health care, and coping resources to limit outdoor exposure during peak pollution events, than affluent populations do.
Protecting Public Health
Our findings revealed that the desiccation of the Great Salt Lake is not merely an ecological crisis. It is also a compounding public health challenge that demands responses across sectors and scales. Depression is expected to become the world’s largest disease burden by 2030. And it is already more common among the most vulnerable in society, the very populations that will have the hardest time finding protections against climate change.
At the community level, one approach to the challenge is to deploy interventions to shield vulnerable communities. Current air quality alerts are framed mainly around respiratory and cardiovascular health risks. Expanding these systems to include mental health considerations would better reflect the full range of potential harms associated with repeated dust exposure. Beyond alerts, local governments and health departments can also consider targeted interventions to help those least able to avoid exposure. These interventions could include opening indoor clean-air shelters during severe pollution events—much like cooling centers used during heat waves—and subsidizing air filtration systems and home weatherization.
Regionally, public health cannot be separated from hydrological stability. Shielding people from, and treating the symptoms of, dust exposure without addressing the shrinking lake bed of the Great Salt Lake (or other changes in blue spaces) is an incomplete strategy. Reversing the lake’s decline will require difficult conversations among stakeholders about watershed management, including the possibility of reducing consumptive water use and rethinking the balance between immediate gains from continued diversions and longer-term benefits of ecological preservation. Accounting for the compounding costs of public health crises, infrastructure degradation, and lost ecological services suggests that preserving the Great Salt Lake is not simply an environmental priority but also a long-term investment in regional resilience.
This research demonstrates the critical value of long-term, open-access public data infrastructure while also highlighting a major practical barrier: Environmental and health datasets remain difficult to integrate.
On a broader scale, physical scientists, public health researchers, clinicians, policymakers, and others—who each still largely work in silos—must work across disciplines if we are to anticipate, measure, and reduce the cascading risks posed by climate-driven environmental change.
Our capabilities for tracking environmental cascades—from drought to lake bed desiccation or from wildfire to smoke exposure, for example—have grown increasingly precise. What remains far less developed is our ability to translate physical signals into a fuller understanding of the public health burden presented by these cascades. That disconnect limits both understanding and response and points to the need for integrative approaches that treat environmental change and health as connected parts of a system of exposure, vulnerability, and human consequences.
Further, this research demonstrates the critical value of long-term, open-access public data infrastructure while also highlighting a major practical barrier: Environmental and health datasets remain difficult to integrate across temporal and spatial scales. The challenge we faced in aligning daily atmospheric data with annual health surveys underscores the need to improve interoperability across data systems maintained by agencies such as NASA, NOAA, USGS, EPA, CDC, SAMHSA, and others.
Greater alignment across these datasets—for example, through satellite imaging of blue spaces and air quality alongside exposure sampling in regions of concern—would make it easier to connect environmental change with health outcomes. It would also help to translate knowledge of emerging risks into actionable public health strategies to protect the mental and physical health of the residents of Utah and beyond.
Author Information
Maheshwari Neelam ([email protected]), Universities Space Research Association and NASA Marshall Space Flight Center, Huntsville, Ala.; and Kamaldeep Bhui, Department of Psychiatry and Wadham College, University of Oxford, Oxford, U.K.