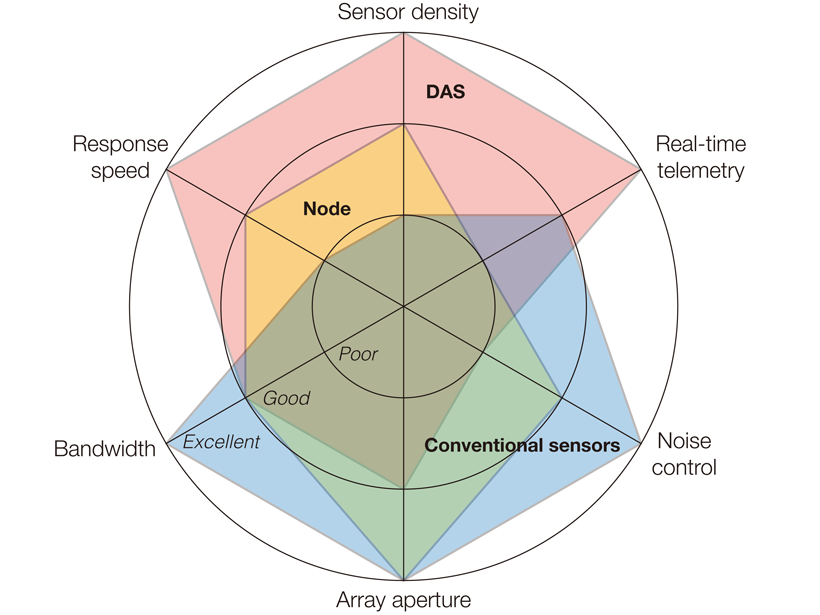
Internet cables can be transformed into a string of dense seismic sensors, and this approach has now been shown to be highly useful for quickly monitoring seismicity after major earthquakes.
AGU Advances
Posted inEditors' Highlights
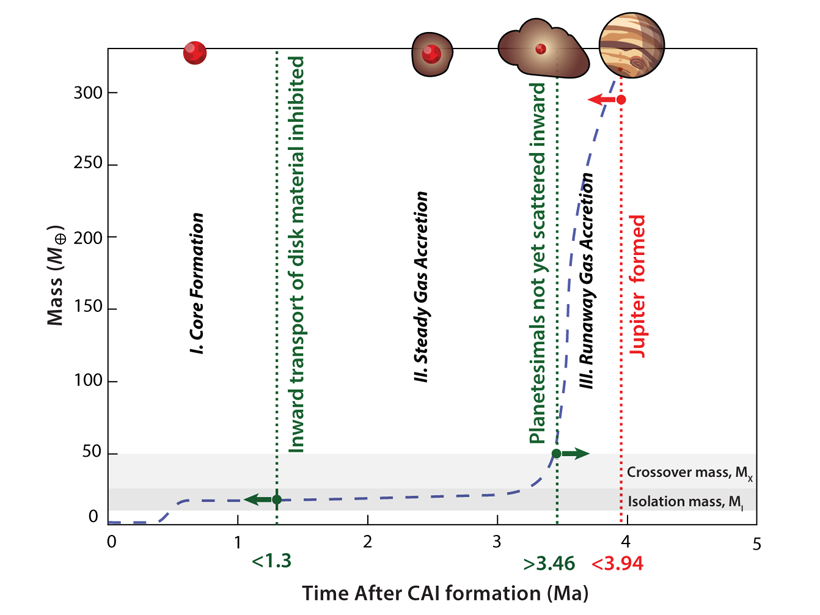
Fingerprints of Jupiter Formation
Meteorite isotopes, meteorite paleomagnetics, and planet formation models collectively show Jupiter formation via first slow then fast collection of material by core accretion in <5 million years.
Posted inEditors' Highlights
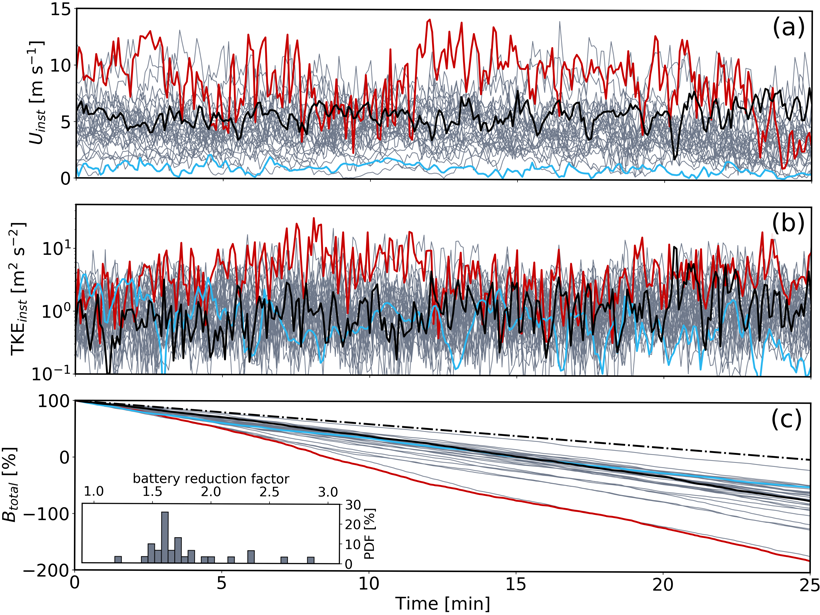
Modeling Urban-Weather Effects Can Inform Aerial Vehicle Flights
Microscale modeling can be used to understand and predict urban weather with sufficient detail to inform and support flight safety for crewed and uncrewed aerial vehicles.

Posted inEditors' Highlights
Raising Central American Orography Improves Climate Simulation
Elevation of Central American orography significantly reduces the pervasive tropical rainfall bias by blocking the easterlies and consequently warming the northeastern tropical Pacific.
Posted inEditors' Highlights
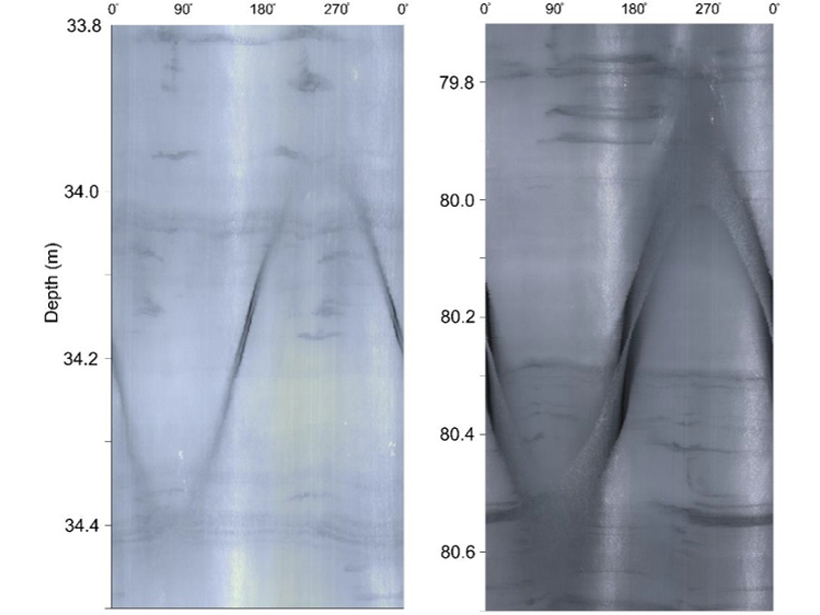
Evidence of Crevasses Transporting Heat Deep into Greenland Ice
Crevasses are a feature of ice sheets but how deep they extend has been a mystery. Now crevasse traces have been visually identified to 265 meters in a borehole in a fast-moving outlet glacier.
Posted inEditors' Highlights
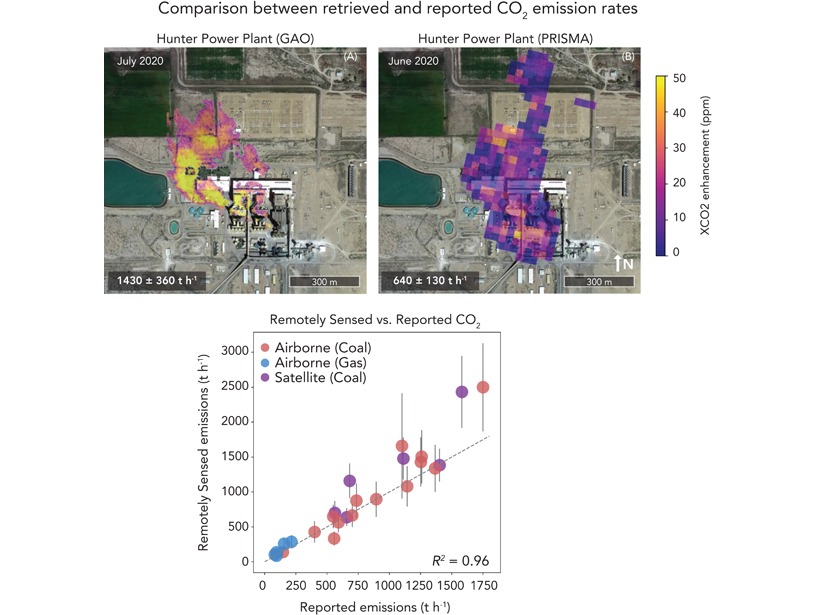
Constraining Global Power Plant Emissions of Carbon Dioxide
Airborne and satellite imaging spectrometers provide accurate quantifying of CO2 emissions at the facility scale, which is important to emission budgets and policy constraints.

Posted inEditors' Highlights
Earthquake Rupture Solution is Up in the Air
Perhaps the most complex earthquake rupture ever studied is further constrained by signals from Earth’s ionosphere.
Posted inEditors' Highlights
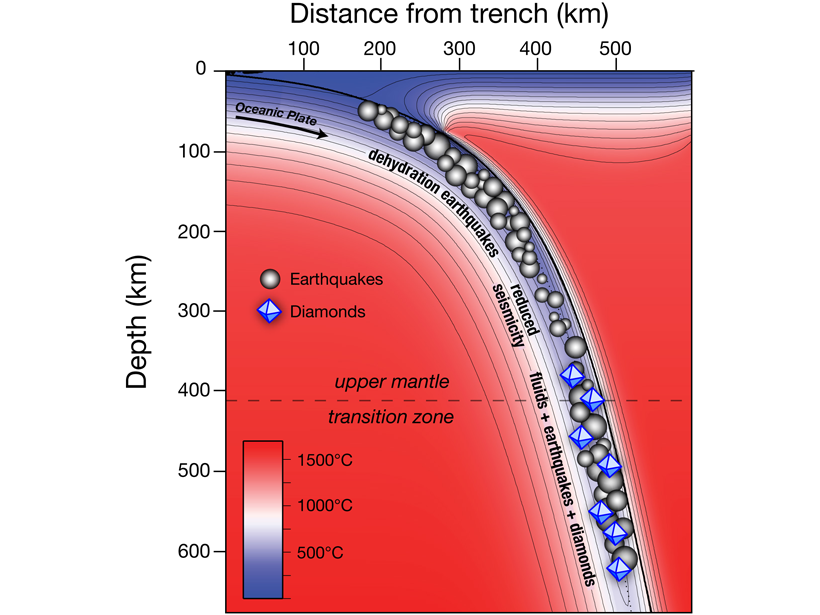
Diamonds Are at Fault
Deep-seated earthquakes in subduction zones are related to diamond formation.

Posted inEditors' Highlights
What’s the Beef About Methane?
Progress has been made to reduce methane emission intensity from livestock (the amount of methane per unit of protein), but where are the greatest opportunities to reduce this methane source further?
Posted inEditors' Highlights
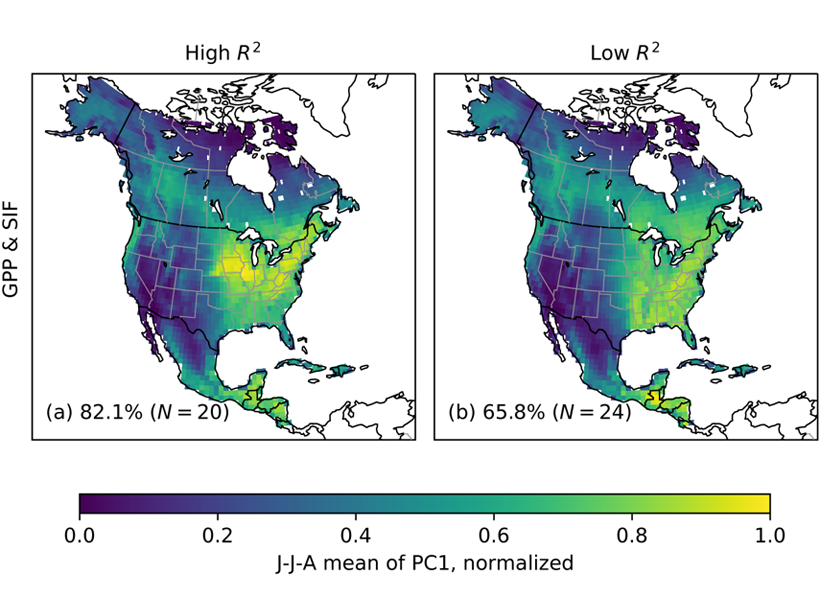
How Do Croplands Reduce CO2 During the Growing Season?
Regional variations in the seasonal drawdown of atmospheric CO2 can be used as a benchmark for evaluating models and satellite-derived estimates of land carbon uptake.