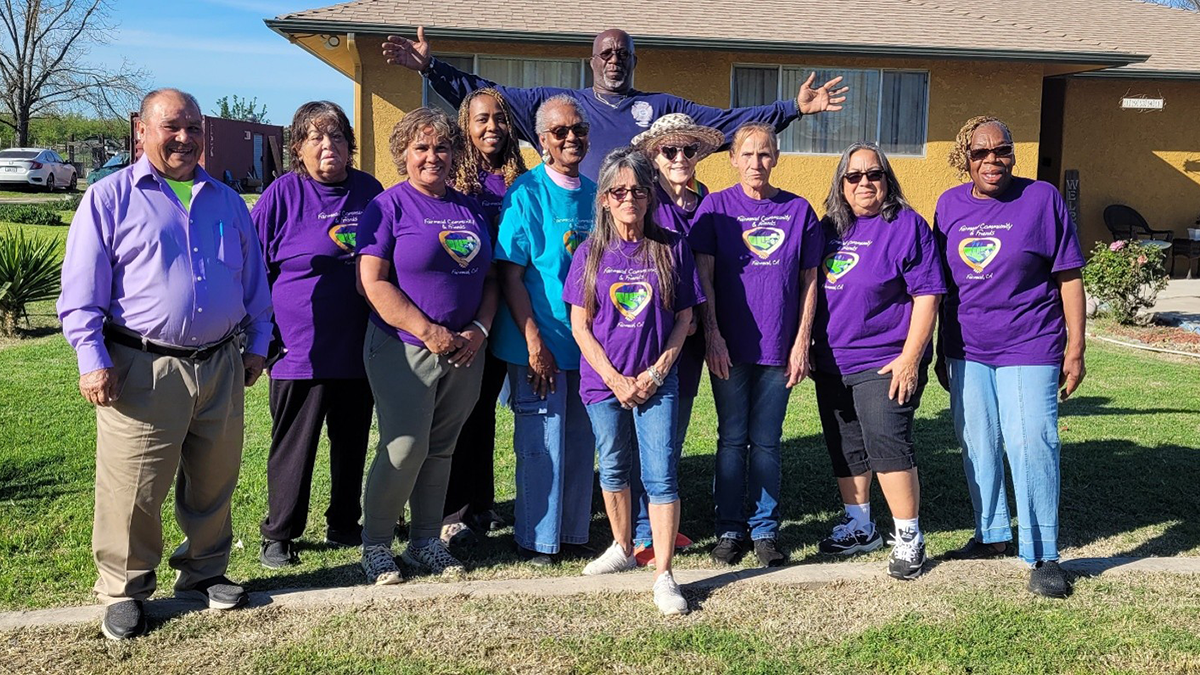
A community-led project in California shows how collaboration can reshape farmland to improve water resources, restore native plants, and create recreational space.
Community Science
Posted inEditors' Highlights
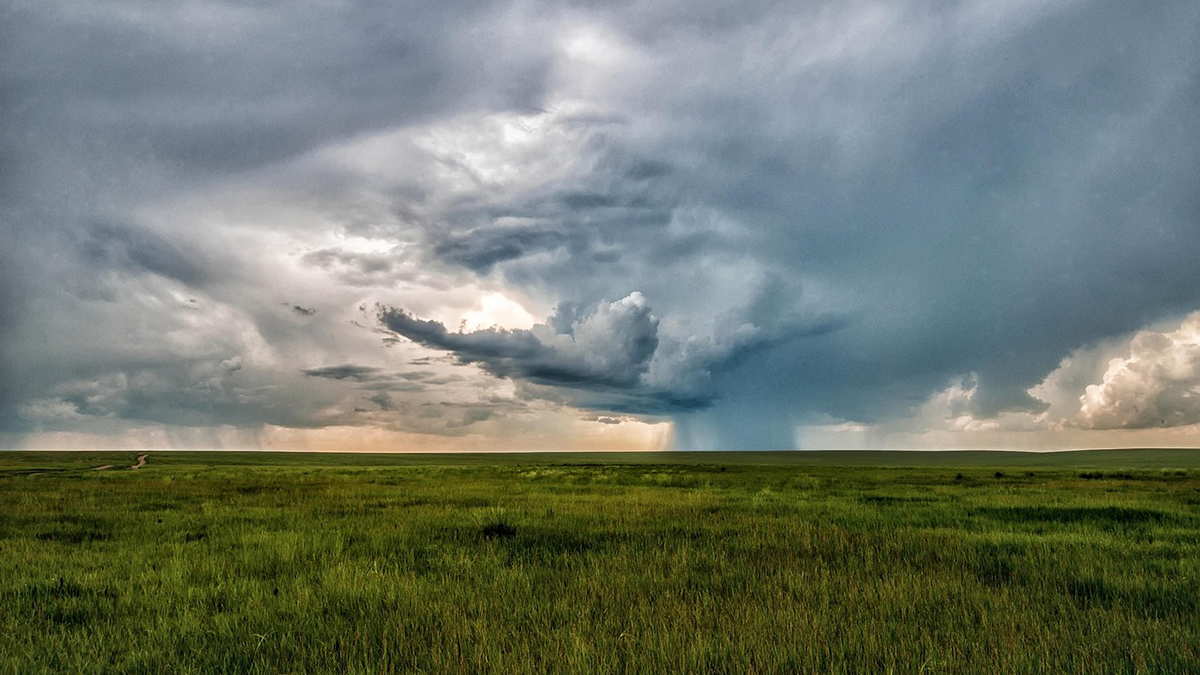
Making Weather and Climate Information Reach the Communities that Need It
Many at-risk communities remain unreached by forecasts due to barriers in language, access, and trust in information systems. A new study looks at how to overcome these.
Posted inResearch Spotlights
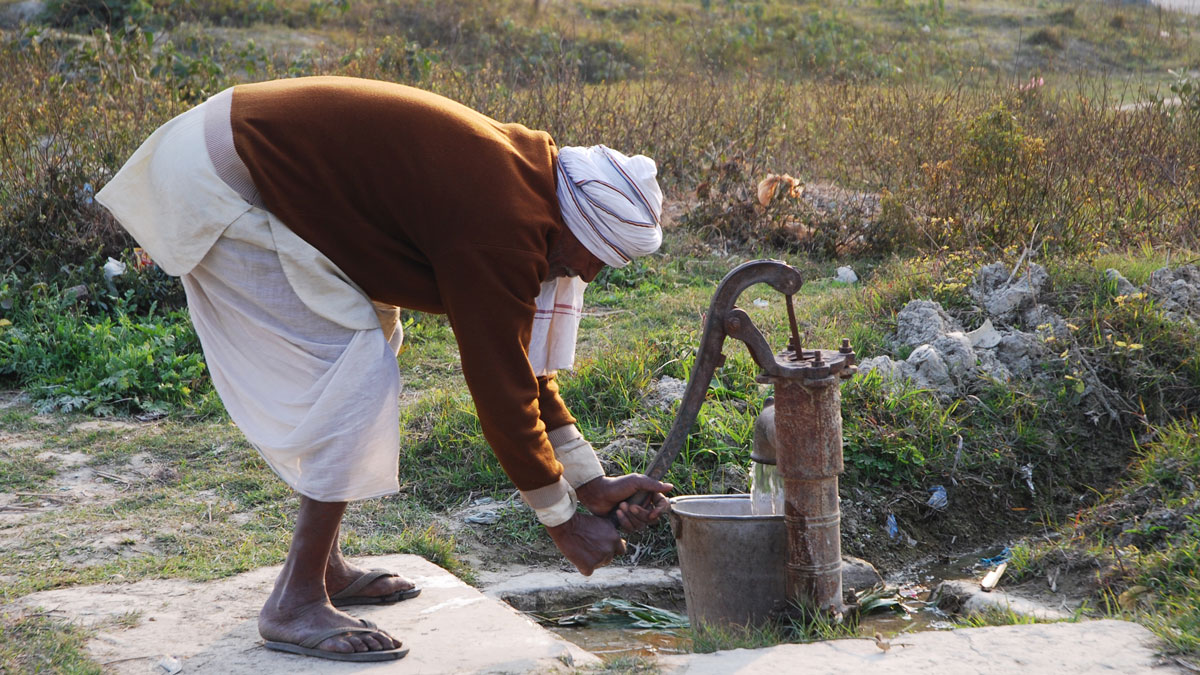
Students Enable Widespread Water Monitoring in India
High school students and other volunteers monitored water for pollutants just as well as professionals.
Posted inEditors' Highlights
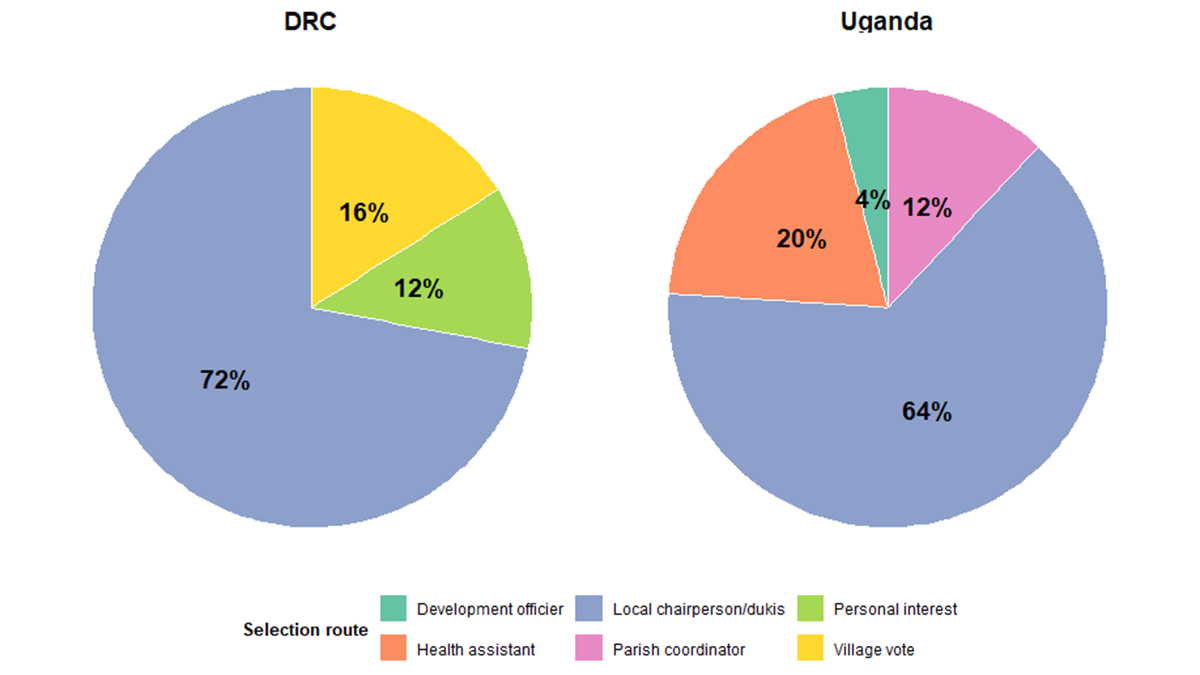
Snail-Borne Diseases in Central Africa: Lessons from Citizen Science
The ATRAP project in the Democratic Republic of Congo and Uganda provides insights to the factors that shape citizen science practice in low- and medium-income countries (LMIC).
Posted inResearch Spotlights
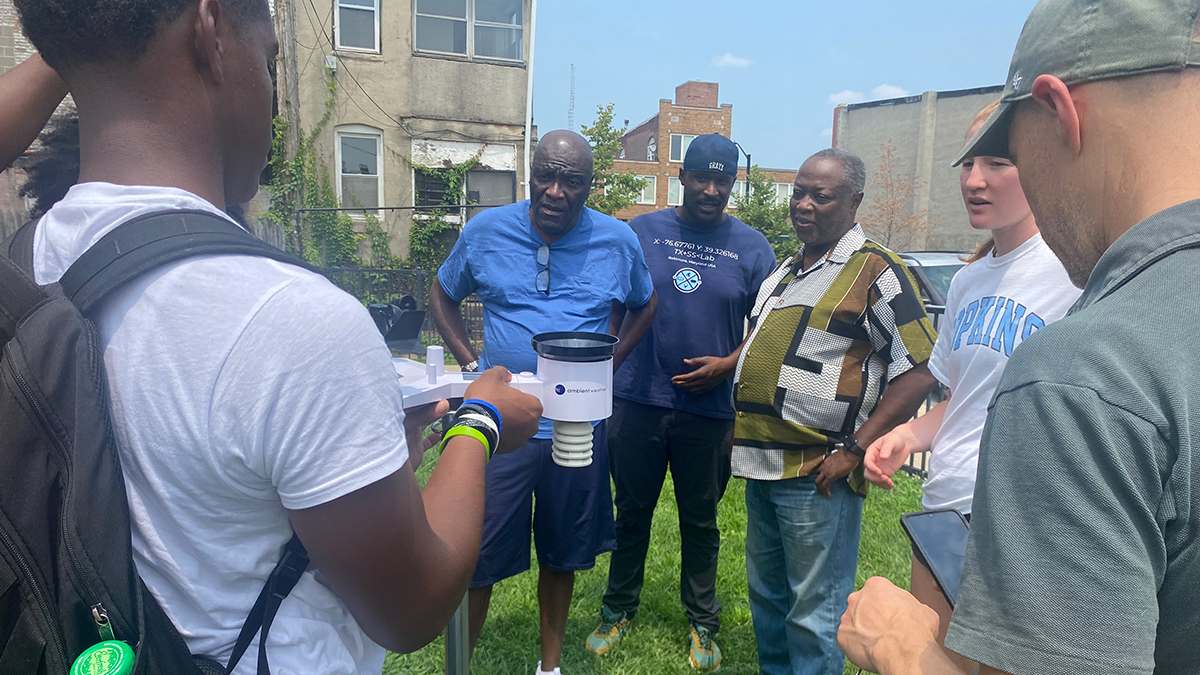
Fixing Baltimore’s Unequal Weather Data Coverage
A new partnership between researchers and community members created a comprehensive network of weather stations across underserved areas of the city.
Posted inResearch Spotlights
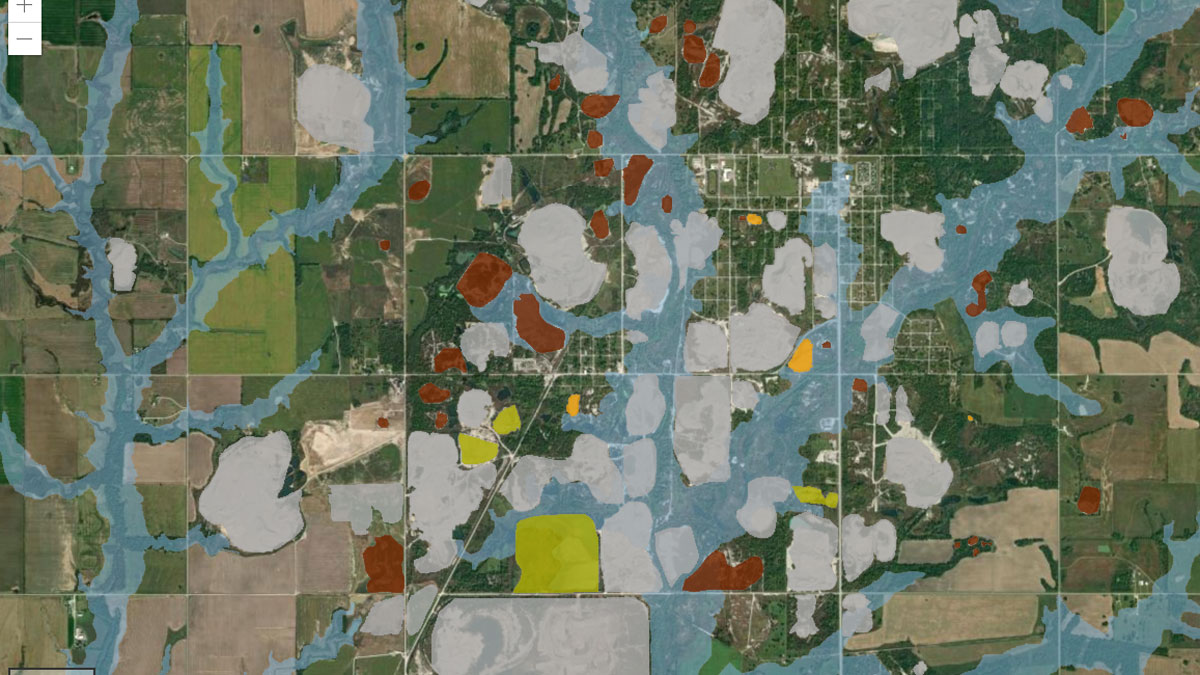
Making a Map to Make a Difference
A new study highlights the partnership between scientists and nonscientist community members in building an interactive GIS map to show flooding risk in a Superfund site.
Posted inResearch Spotlights
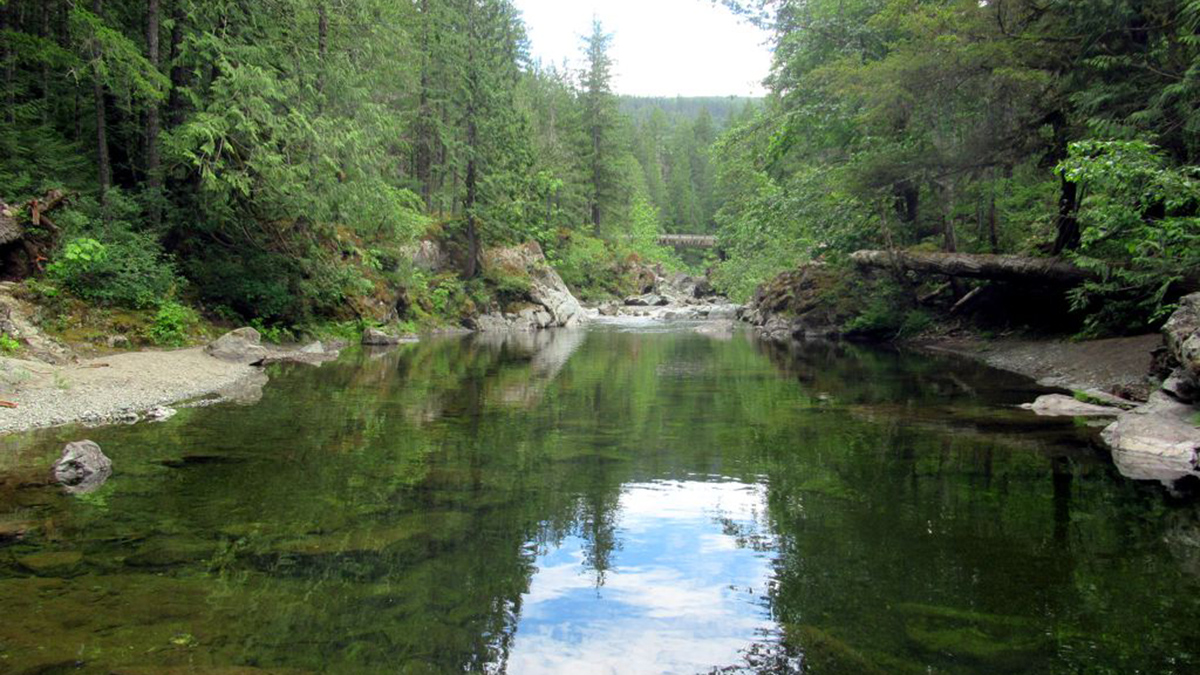
Watershed Sustainability Project Centers Place-Based Research
A community science project supports an innovative watershed management plan.
Posted inEditors' Highlights
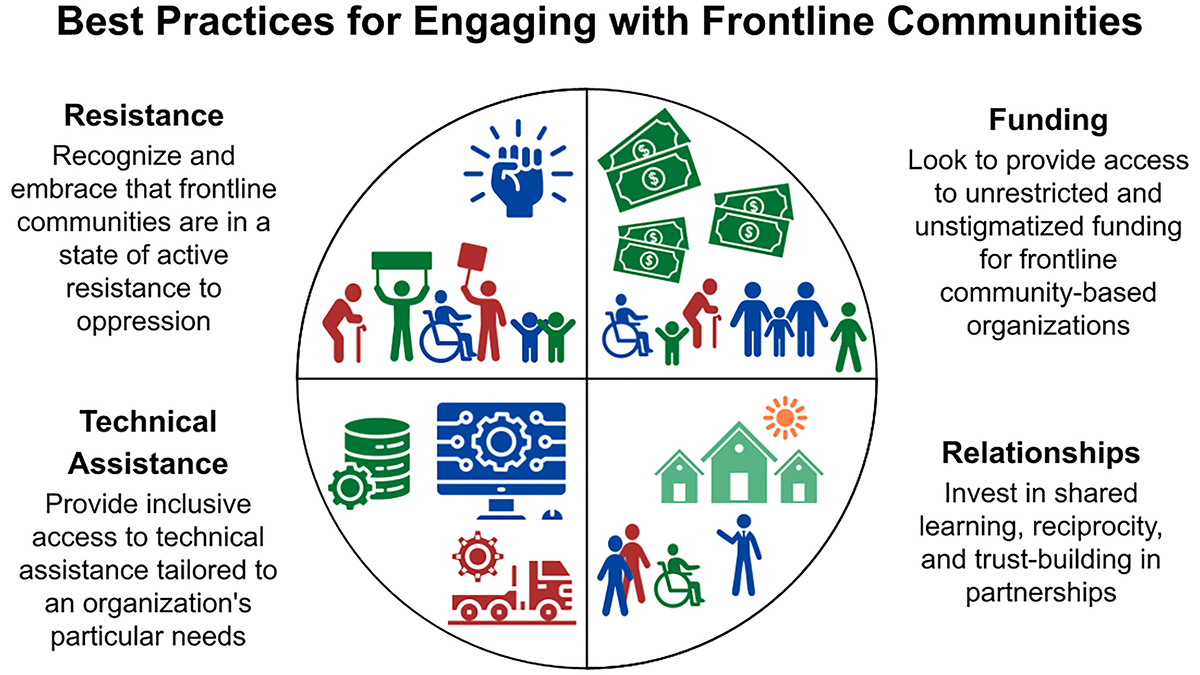
Rethinking Engagement with Frontline Communities
A new perspective from community-based organizations explains how scientists, funders, and other supporters can collaborate ethically and effectively while respecting community identities and priorities.
Posted inEditors' Highlights
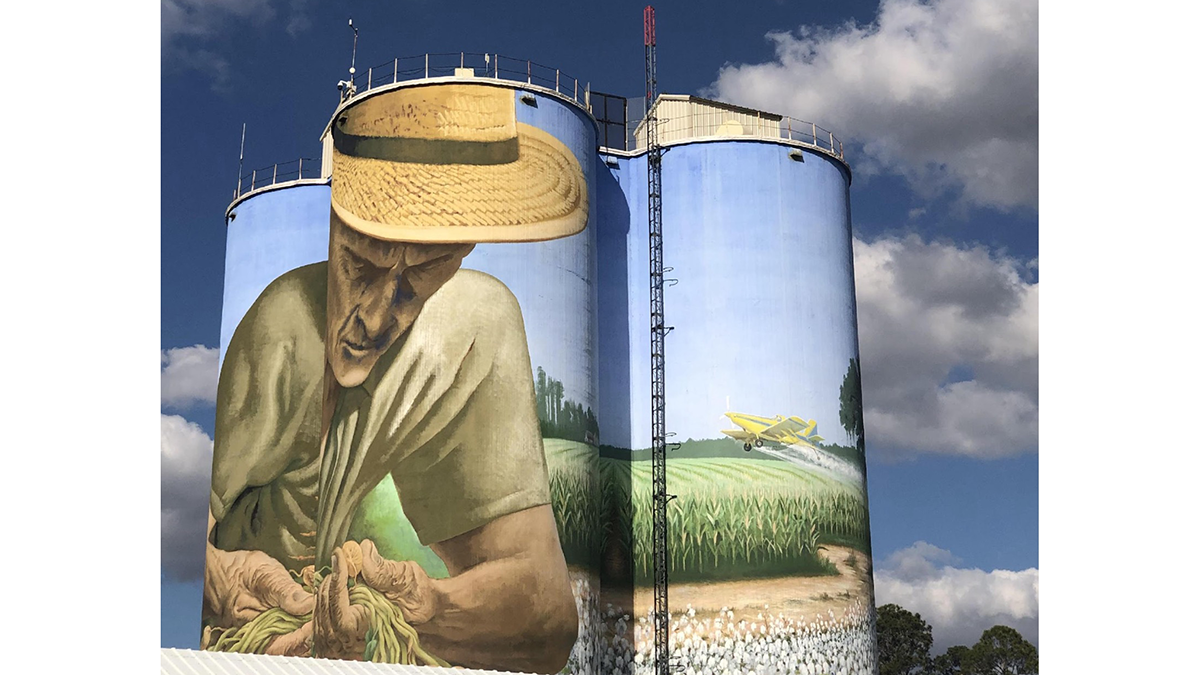
Voicing Farmers’ Concerns on the Future of Agriculture
A new study explores the deep, multi-faceted concerns of small- and mid-scale farmers about the direction of farming and food systems in the United States.
Posted inEditors' Vox
Publishing Participatory Science: The Community Science Exchange
Our peer-reviewed journal and innovative editor-vetted Hub offer new ways to share research performed by, with, and for communities.