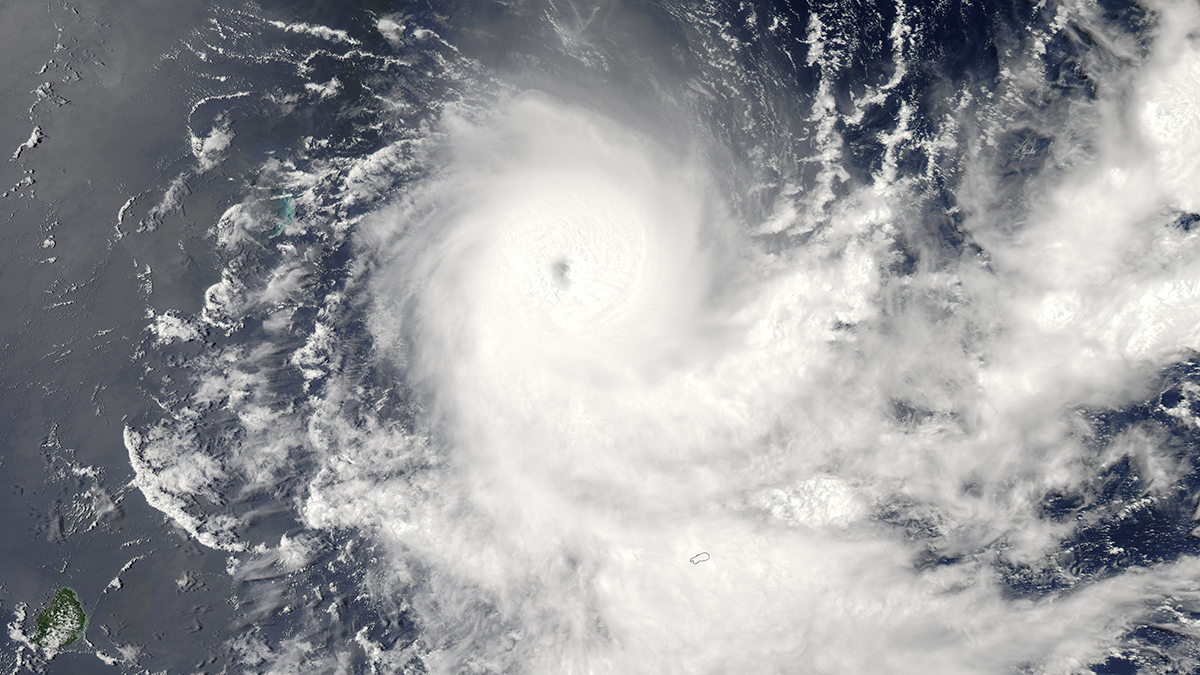
Tropopause temperature biases create major tropical cyclone differences in models; cooler air boosts storm potential intensity, raising global cyclone frequency and hurricanes in experiments.
everything atmospheric
Posted inResearch & Developments, Uncategorized
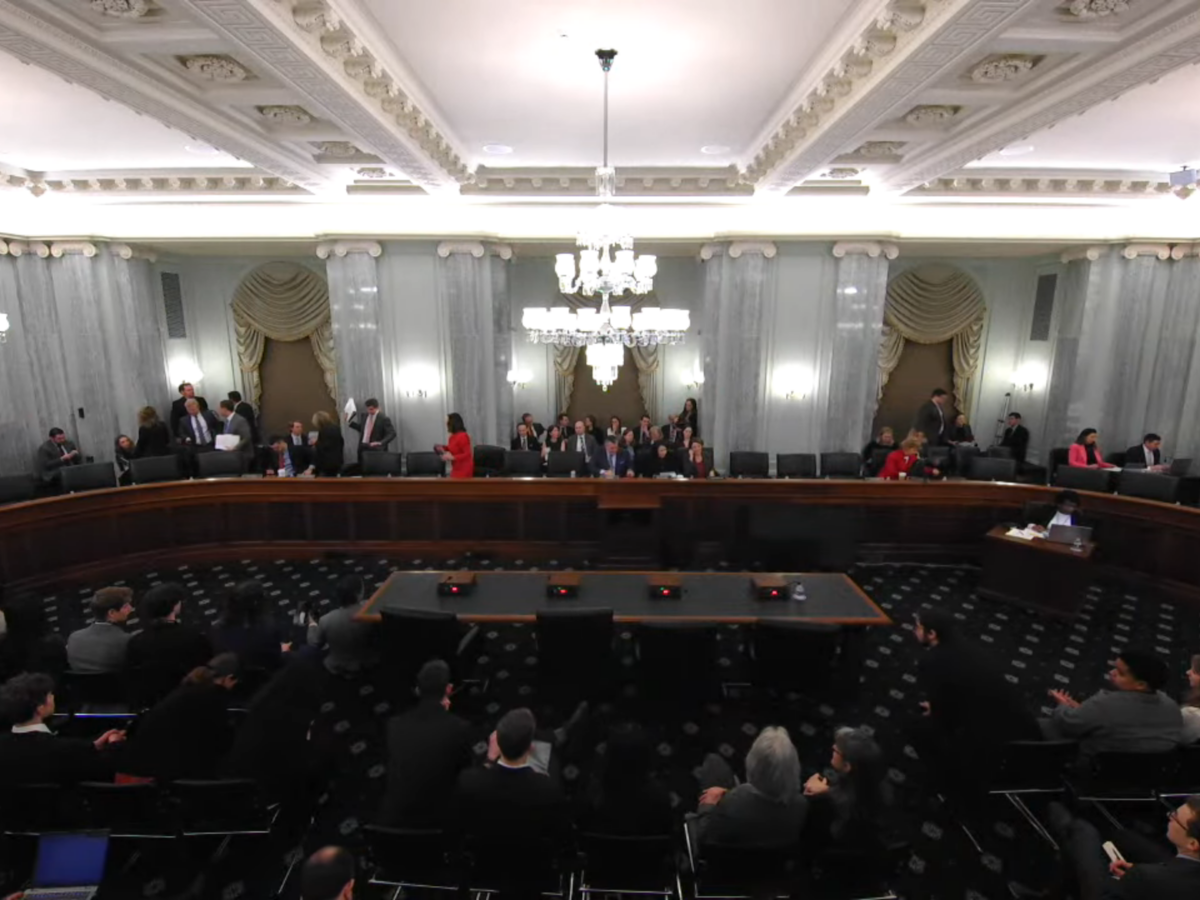
Senate Committee Approves Bill to Expand NOAA Capabilities
The markup meeting, to discuss the NASA Transition Authorization Act of 2026 and the Weather Research and Forecasting Innovation Reauthorization Act of 2026, lasted less than 20 minutes.
Posted inEditors' Highlights
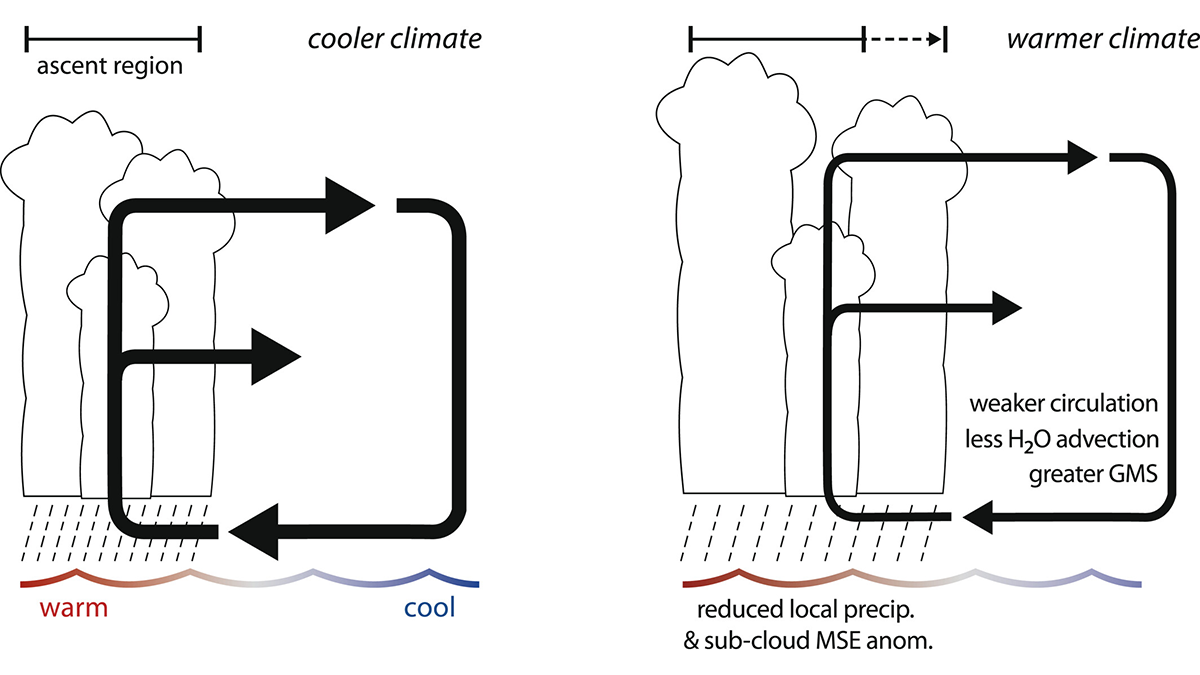
The “Wet-Gets-Wetter” Response to Climate Change Does Not Always Apply
While the precipitation response to a warming climate is often stated as the “wet gets wetter,” this response does not apply to east-west overturning circulations like the Pacific Walker circulation.
Posted inEditors' Highlights
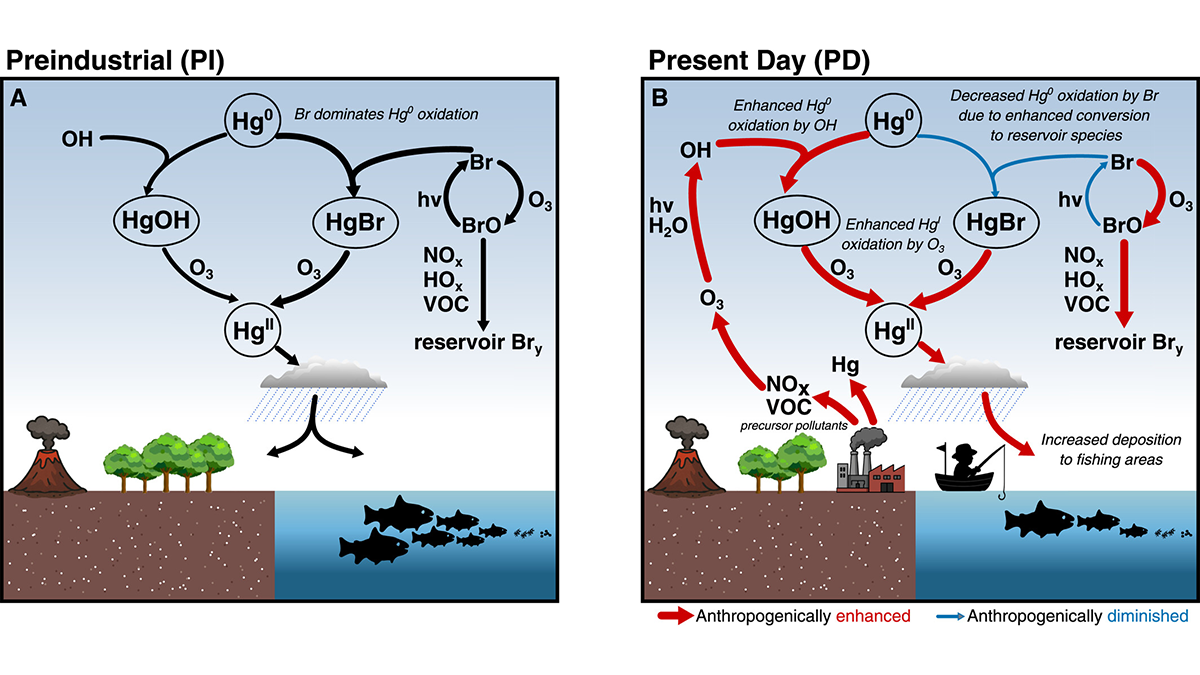
Human Effects on Background Atmosphere have Affected Mercury Chemistry
Atmospheric mercury chemistry has evolved over time due to changes in atmospheric composition, especially for changing concentrations of bromine radicals, hydroxyl radicals, and ozone.
Posted inEditors' Highlights
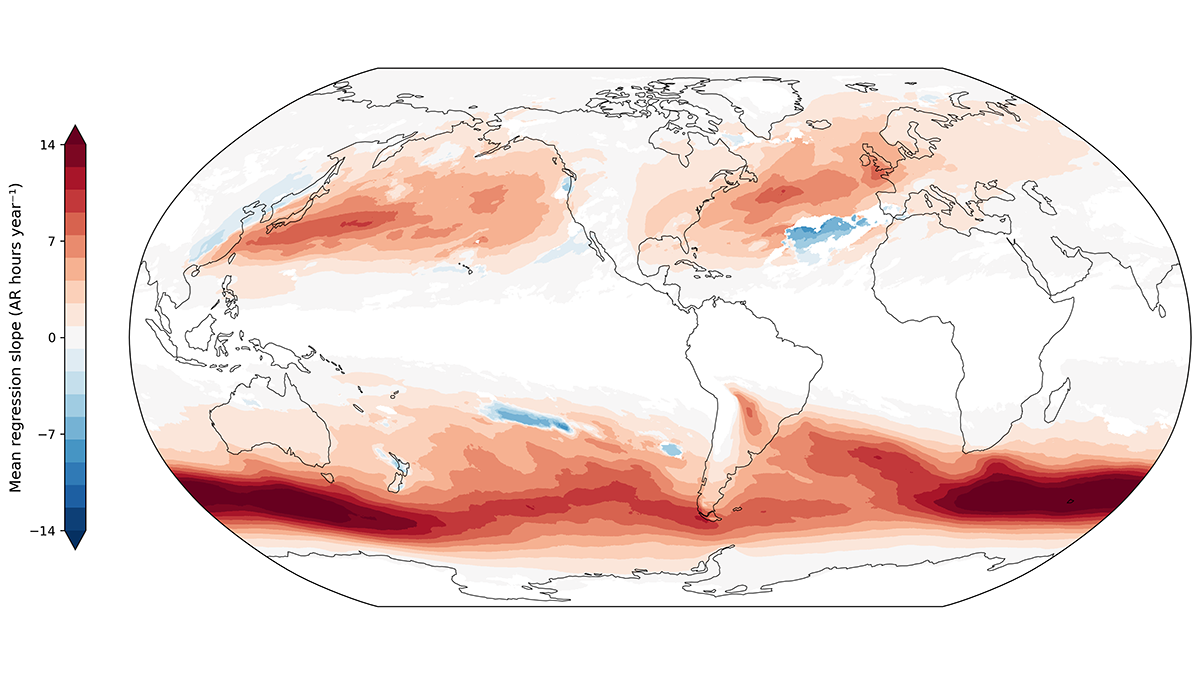
Future Hotspots of Hazardous Rivers in the Atmosphere
Atmospheric rivers can produce heavy precipitation and associated hazards worldwide. A new study identifies regions where these hazards have already, and will further, increase with global heating.

Posted inNews
Marine Heat Waves Can Increase Coastal Rainfall
Unusually warm ocean waters can amplify extreme rainfall in downwind areas, leaving coastal communities—especially those in developing countries—at risk.

Posted inEditors' Highlights
Understanding Aerosol-Cloud Interactions is Pivotal for Improving Climate Predictions
Global cooperation and knowledge sharing are essential to improve our understanding of cloud formation and evolution through aerosol-cloud interaction.
Posted inEditors' Highlights
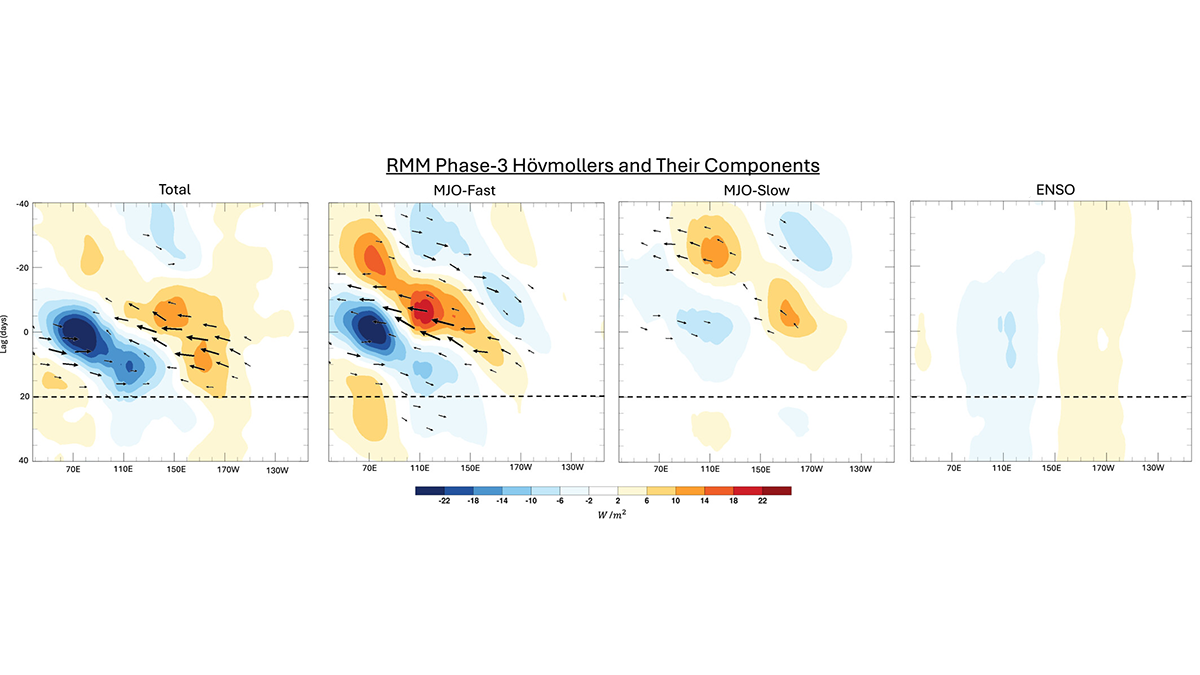
Slow and Fast Madden-Julian Oscillation Modes
The skill of Madden-Julian Oscillation (MJO) forecasts can be improved by identifying slow- and fast-MJO modes and their superposition.
Posted inEditors' Highlights
Linking Space Weather and Atmospheric Changes With Cosmic Rays
Water-Cherenkov cosmic-ray detectors can be used as a tool for monitoring and studying changes in the lower stratosphere over Antarctica.
Posted inEditors' Highlights
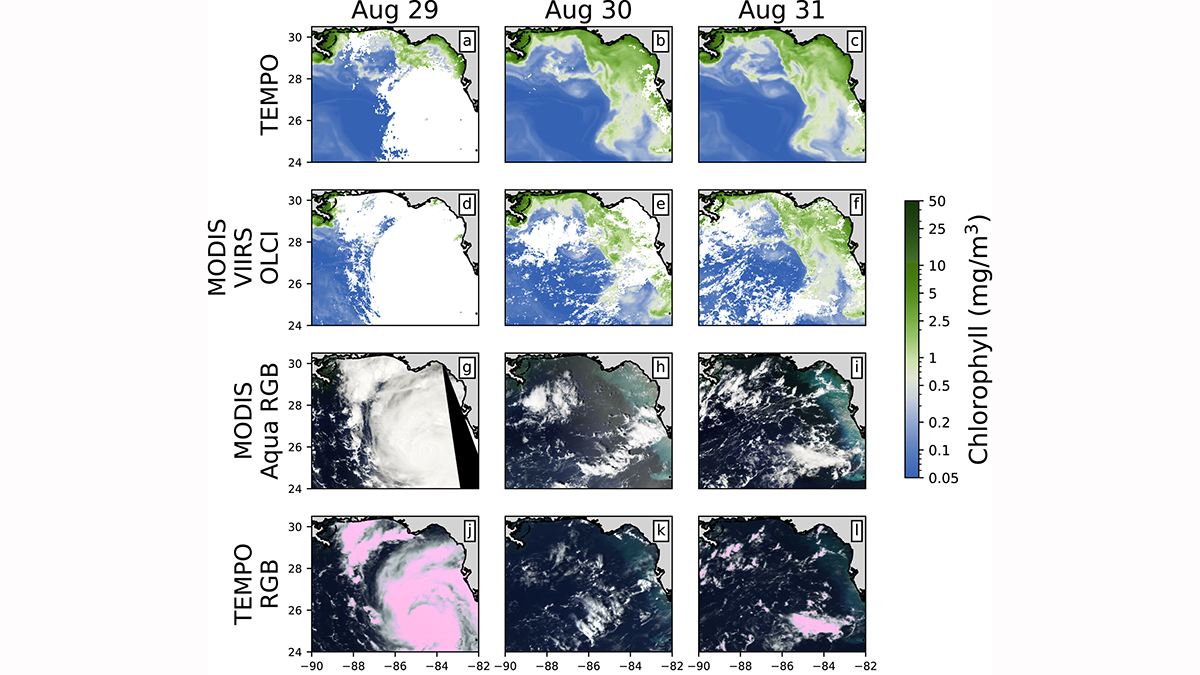
Monitoring Ocean Color From Deep Space: A TEMPO Study
Scientists apply machine learning to demonstrate that geosynchronous satellites can be used to assess the health of oceans from deep space.