
High humidity and low temperature altered COVID-19 spread in Brazil, but only slightly.
GeoHealth (journal)
Posted inEditors' Vox
GeoHealth Expands Topical Areas with New Editors
AGU’s interdisciplinary journal, GeoHealth, adds three new experts to its editorial board as it continues to grow in submissions, impact, and scope.
Posted inResearch Spotlights
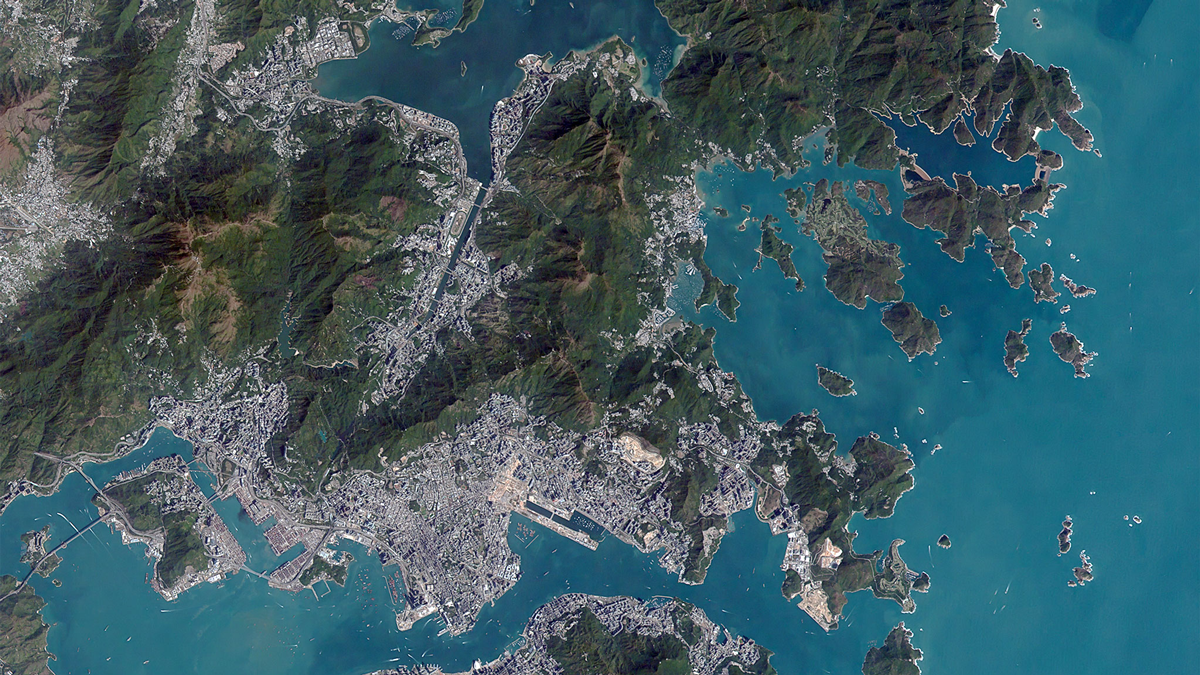
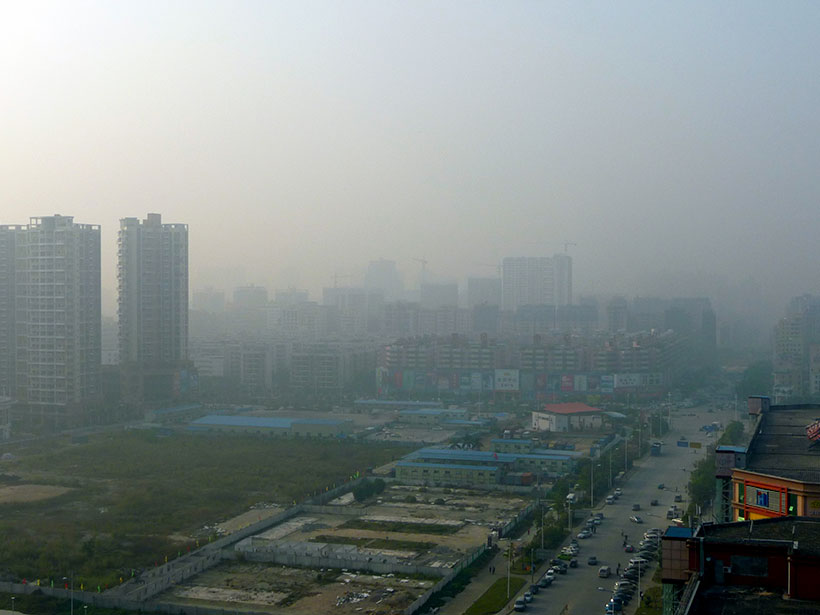
通过街道污染估计图选择更健康的通行路线
研究人员采用一种新的高分辨率方法结合多种类型的遥感污染数据,开发出一款应用程序,可为城市通勤者绘制最健康的路线。
Posted inEditors' Vox
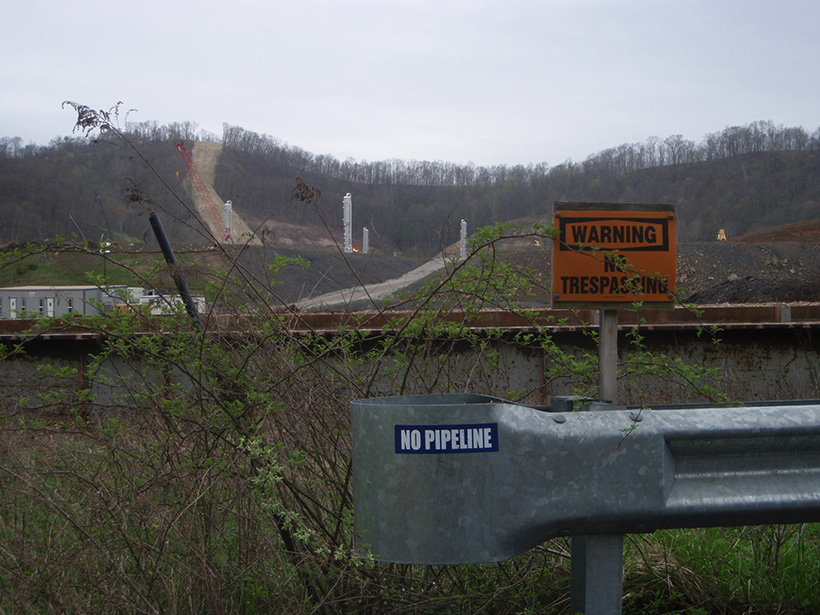
Using Data to Mitigate Inequitable Environmental Burdens
A new transdisciplinary special collection welcomes studies exploring data and tools for identifying and mitigating environmental injustice.

Posted inEditors' Highlights
Community Scientists Help to Beat the Heat
As cities face health threats from heat and air pollution—both expected to worsen from climate change—researchers pilot a community scientist effort to map air quality and improve urban health.
Posted inEditors' Highlights
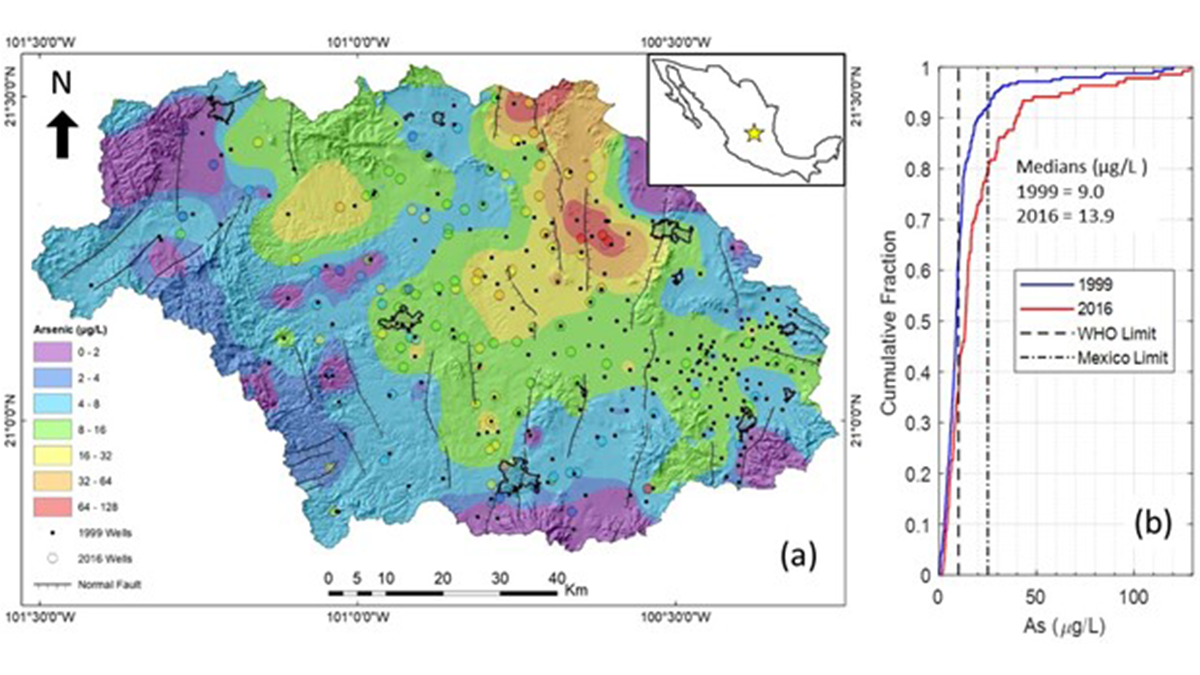
Protecting Children’s Health Can Benefit the Economy
A new study presents an integrated approach to predicting the human health impacts, economic implications, and remediation solutions for using contaminated groundwater in Central Mexico.

Posted inResearch Spotlights
Higher Lead Concentrations Found in Diseased Bones
Researchers compared trace element concentrations in patients with and without osteoporosis, finding possible differences in bone geochemistry between the groups.
Posted inResearch Spotlights
The Health and Climate Benefits of Reducing Air Pollution
In a new study, researchers apply a global Earth system model to estimate the impacts of emissions reductions by sector.

Posted inResearch Spotlights
Scientists Uncover the Seasonality of COVID-19
Researchers identify the environmental variables driving the seasonality of the novel coronavirus.