
High-resolution seismic models of the Nova Scotia margin reveal a role for magmatism in continental breakup, even at magma-poor sections of the eastern North American margin.
Journal of Geophysical Research: Solid Earth

Posted inResearch Spotlights
Radiometric Dating Sheds Light on Tectonic Debate
The emplacement of the Samail Ophiolite in Oman has been a source of disagreement among geologists. New state-of-the-art research offers a fresh perspective on its timing and geometry.

Posted inEditors' Highlights
An Unstable Magnetic Field in Central Asia 2500-1500 Years Ago
The geomagnetic field intensity – poorly described – varies spatially and temporally on centennial time scales. A recent study fills an important gap in Central Asia and discusses global implications.

Posted inEditors' Highlights
American Legacy Paleosecular Variation Data Unlocked
The geomagnetic field changes regionally on centennial time scales. A recent study unlocks three historical archives from the “Four Corners” region (southwest USA) reconciling previous discrepancies.

Posted inResearch Spotlights
Measuring Sea Level Rise Along the Coast
Scientists created a global map of vertical land motion to show how the solid ground is moving relative to the planet’s rising seas.
Posted inEditors' Highlights
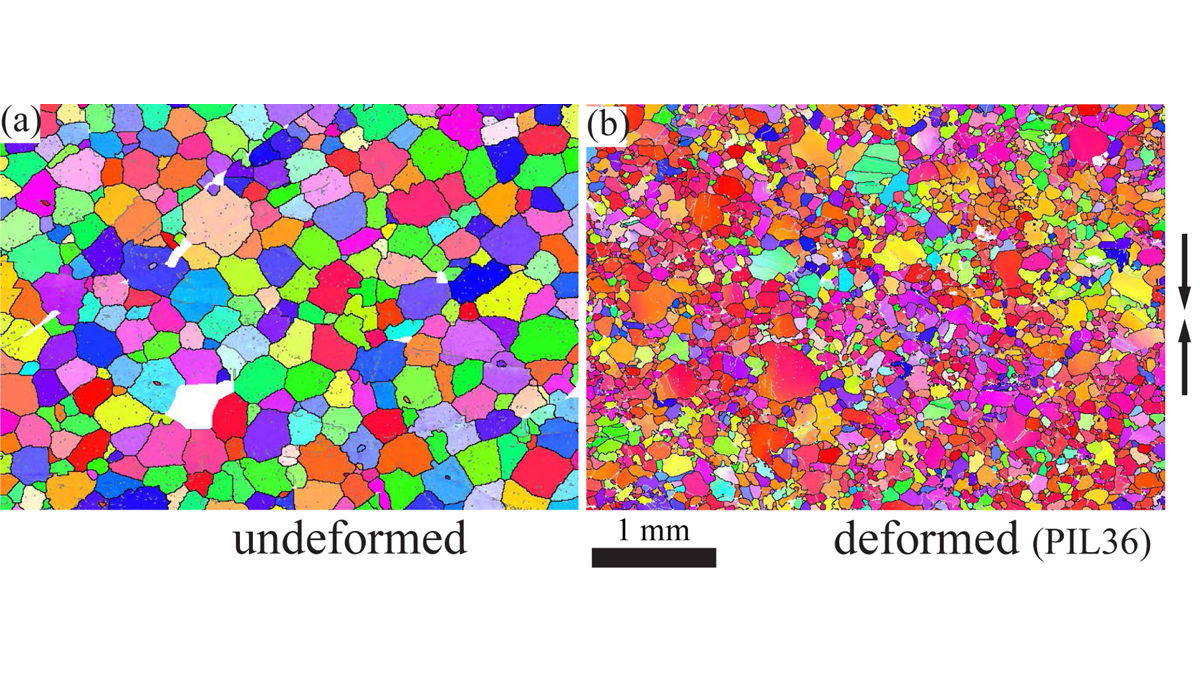
Ice on a Deadline: More Stress Makes Ice Move Faster
Anyone seeing photographs of glacier and ice sheets from above clearly sees that they flow; recent laboratory tests on ice further reveal the conditions that control just how fast this happens.
Posted inEditors' Highlights
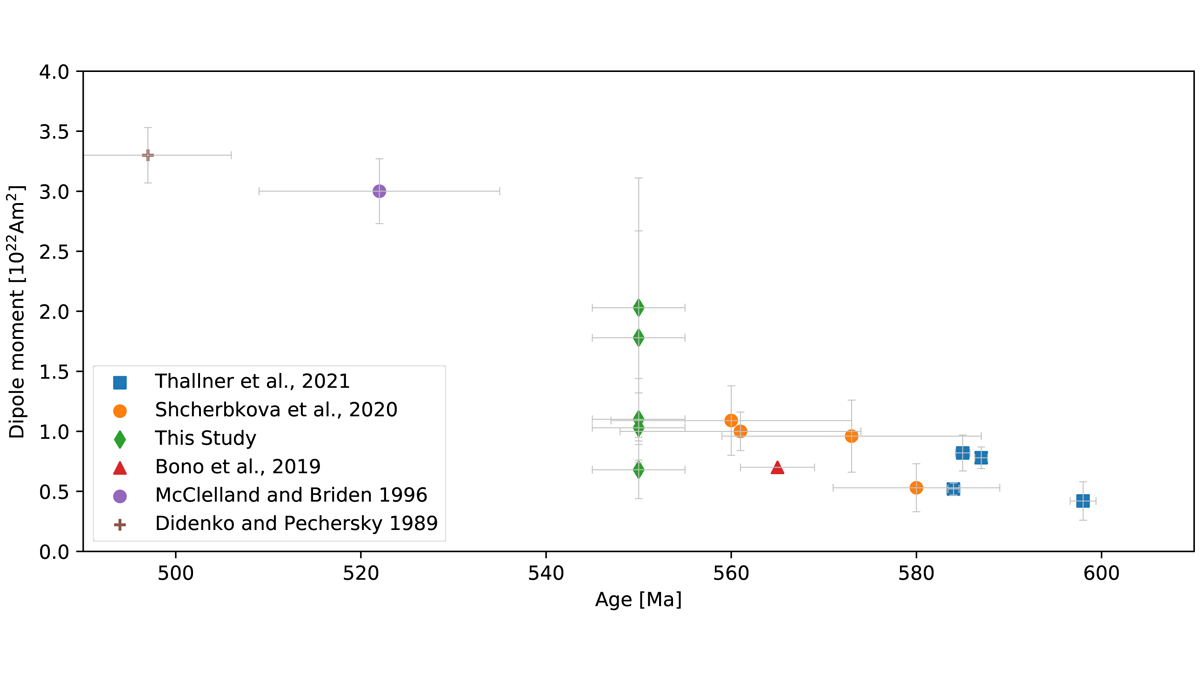
A Dipole Field from the Ediacaran-Cambrian Transition Onward?
The Ediacaran features an instable magnetic field complicating paleogeographic reconstructions; a new paleointensity study on late Ediacaran rocks indicates a weak but stable dipolar field.
Posted inEditors' Highlights
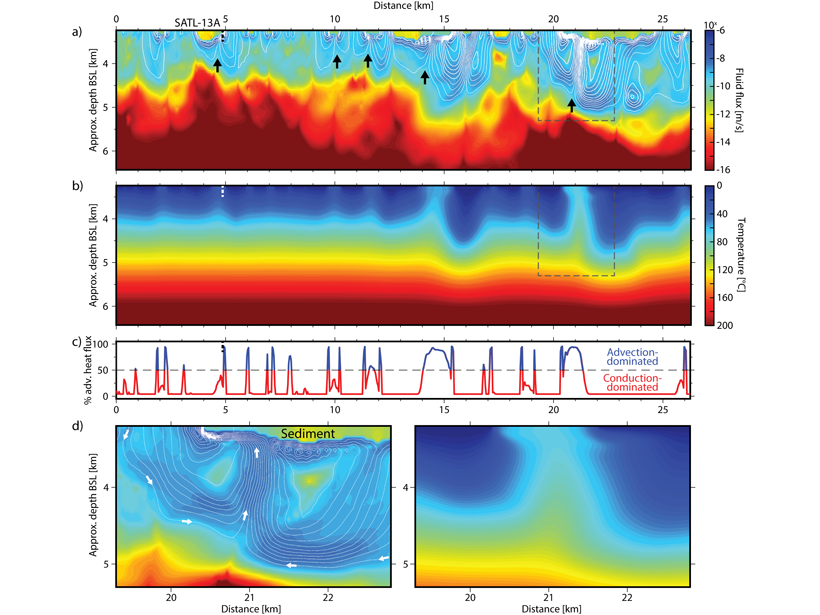
Mechanisms of Hydrothermal Ocean Plate Cooling Revealed
A combination of waveform tomography and hydrothermal modelling allows characterizing the mechanisms and reach of fluid flux and ocean plate cooling near mid-ocean ridges with unprecedented detail.

Posted inResearch Spotlights
Long-Term Sea Level Cycle Affects Predictions of Future Rise
New research confirms the existence of a regular, long-term fluctuation in sea level, perhaps caused by processes in Earth’s core.