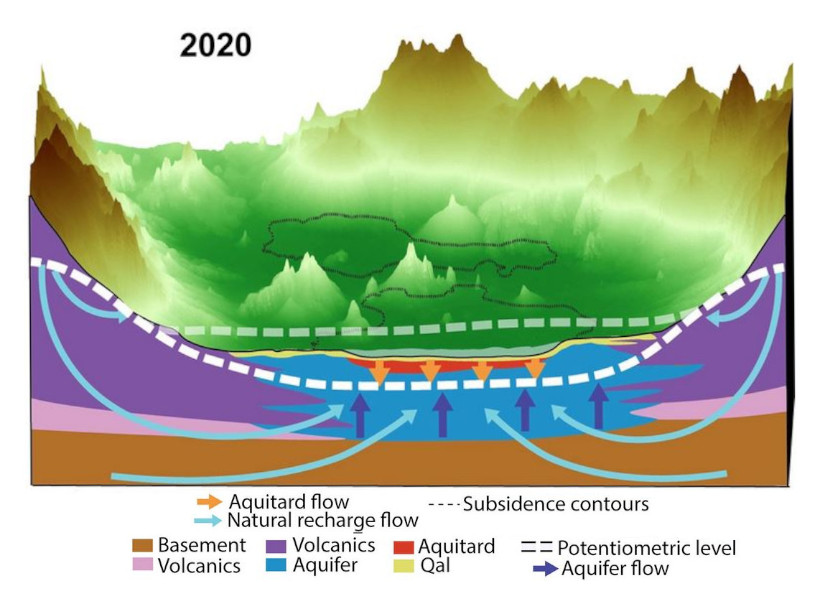
New research reveals the cause of Mexico City’s rapidly sinking and fracturing ground.
Journal of Geophysical Research: Solid Earth

Posted inEditors' Highlights
Relating Seismicity and Volcano Eruptions
A global study suggests that volcanic eruption forecasting and detection may be improved by examining earthquake mechanisms and clustering in combination with individual volcano properties.

Posted inEditors' Highlights
Probing the Age of the Oldest Ocean Crust in the Pacific
A new study extends the calibration of the Mesozoic Sequence down to the Mid Jurassic with multiscale marine magnetic anomaly data, demonstrating extraordinarily high reversal frequency.
Posted inEditors' Highlights
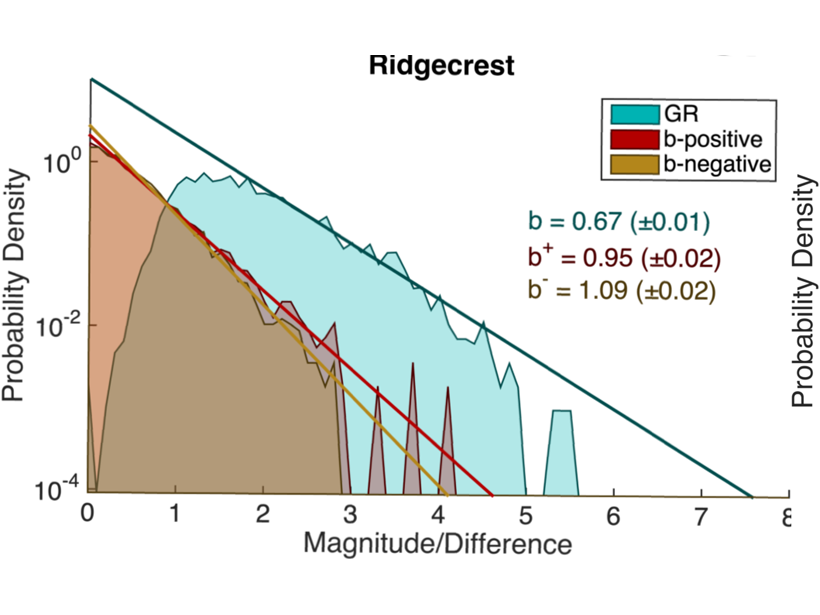
A New Robust Estimator of Earthquake Magnitude Distribution
The b-value, which describes the fraction of large versus small earthquakes, is less sensitive to transient changes in detection threshold and may improve the detection of precursory changes.

Posted inResearch Spotlights
The First Angstrom-Scale View of Weathering
Researchers observe how water vapor and liquid alter sedimentary rocks through physical and chemical processes.
Posted inEditors' Highlights
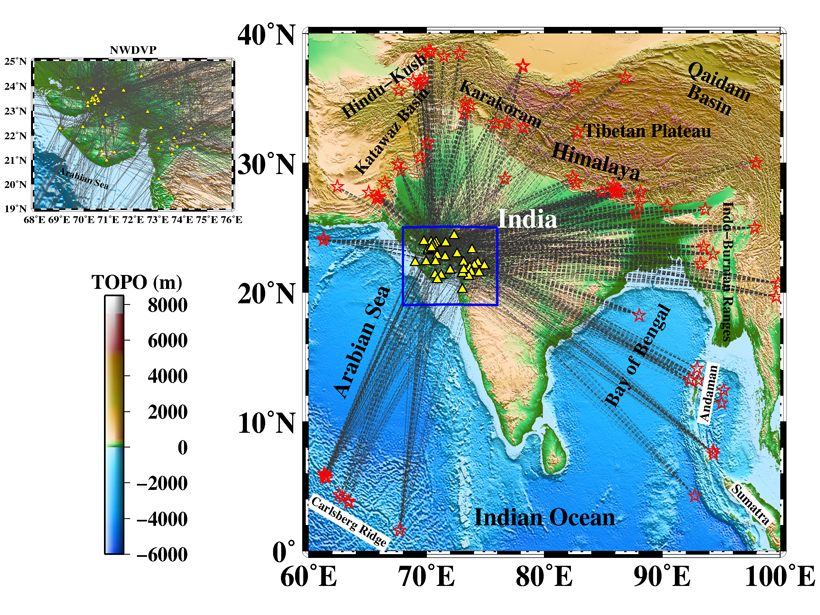
Hunting the Source of Deccan Traps Volcanism Using Seismic Waves
Seismic velocity patterns beneath the Deccan Traps region in western India reveal its volcanic history.

Posted inResearch Spotlights
An Innovative Approach for Investigating Subduction Slip Budgets
A new 3D model offers a state-of-the-art look at the full spectrum of slip behaviors in the Nankai subduction zone off Japan.
Posted inResearch Spotlights
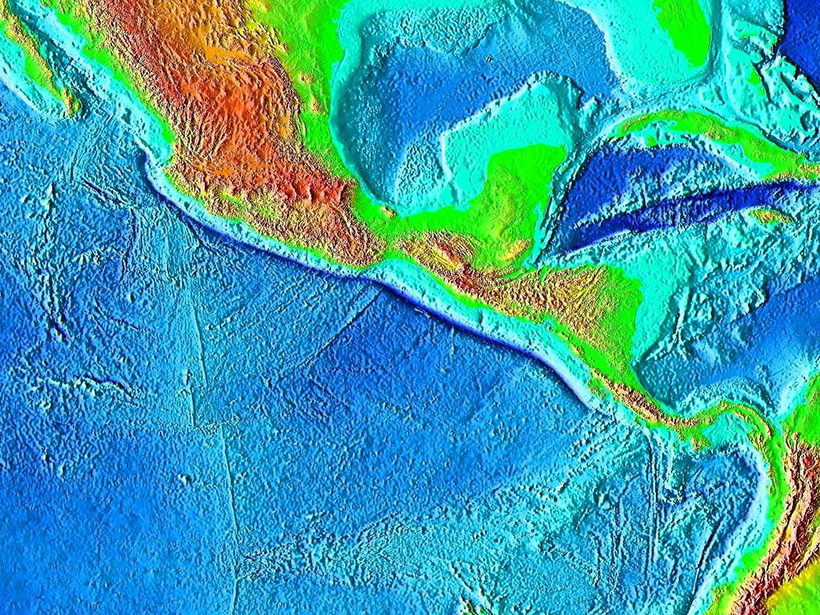
Subduction May Recycle Less Water Than Thought
A new analysis of seismic data from the Middle America Trench suggests that previous calculations have vastly overestimated the total amount of water transported to the mantle worldwide.
Posted inEditors' Highlights
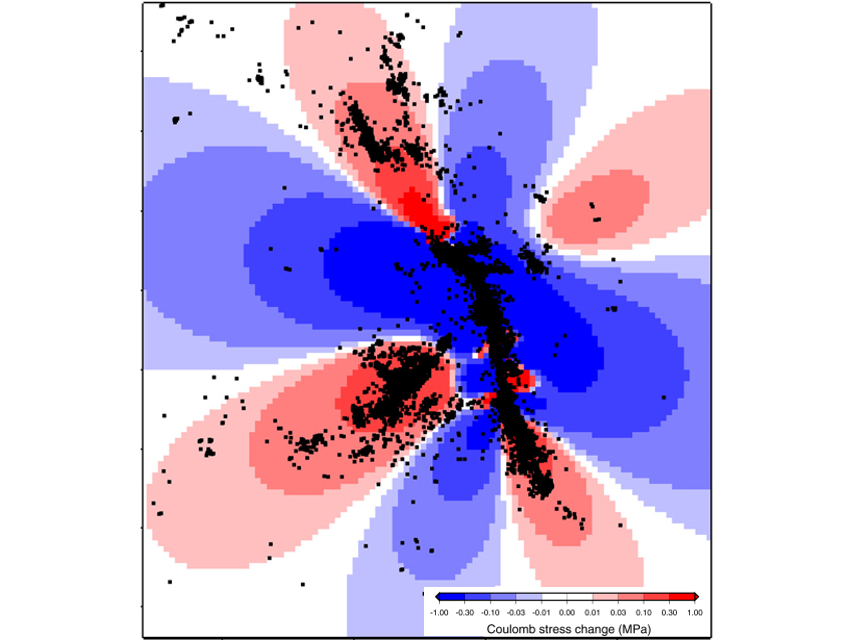
The Failure of Physics-Based Earthquake Forecasting Models
Spatial clustering of aftershocks explains why simple statistical models often outperform complex physics‐based earthquake forecasting models even if the physical mechanisms are correctly modeled.
Posted inResearch Spotlights
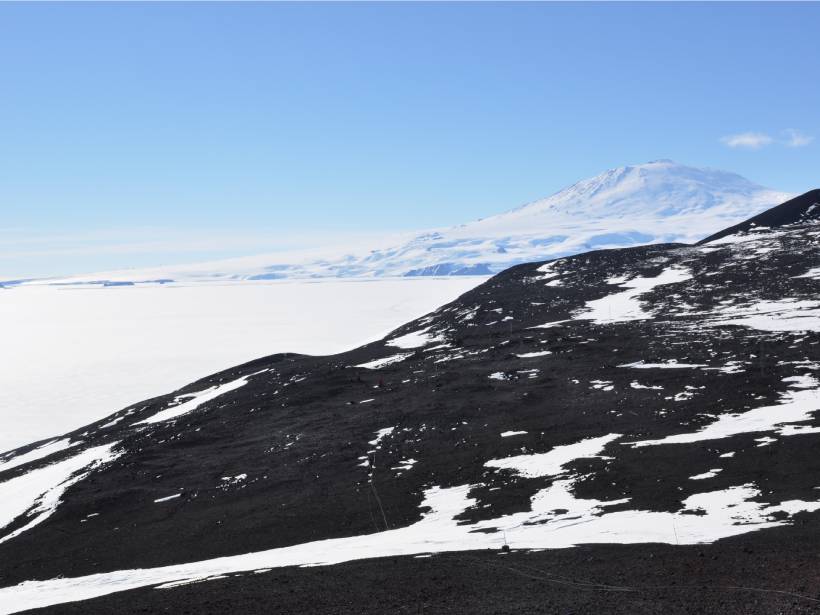
Antarctic Lava Yields Clues to Earth’s Past Magnetic Field
A new analysis suggests that a widely accepted approximation of ancient magnetic field strength may be less accurate for the past 5 million years than previously thought.