
A new study in the Negev Desert finds that long-term erosion of a desert escarpment occurs in drier areas where intense storms are most frequent.
rain

Posted inResearch Spotlights
Exploring Just How Extreme Future Storms Could Get
A novel approach to storm simulations could help prepare for increasingly heavy precipitation events.

Posted inEditors' Highlights
Wet Conditions Delay Wildfire Detection
When accompanied by a considerable amount of rainfall, ignition of wildfire by lightning over forested land may not be detected until days later.

Posted inEditors' Highlights
Modeling the Outer Winds of Tropical Cyclones
A new analytical solution for Emanuel’s theory on how the winds vary with the distance from the hurricane center outside of the core of the storm.
Posted inEditors' Vox
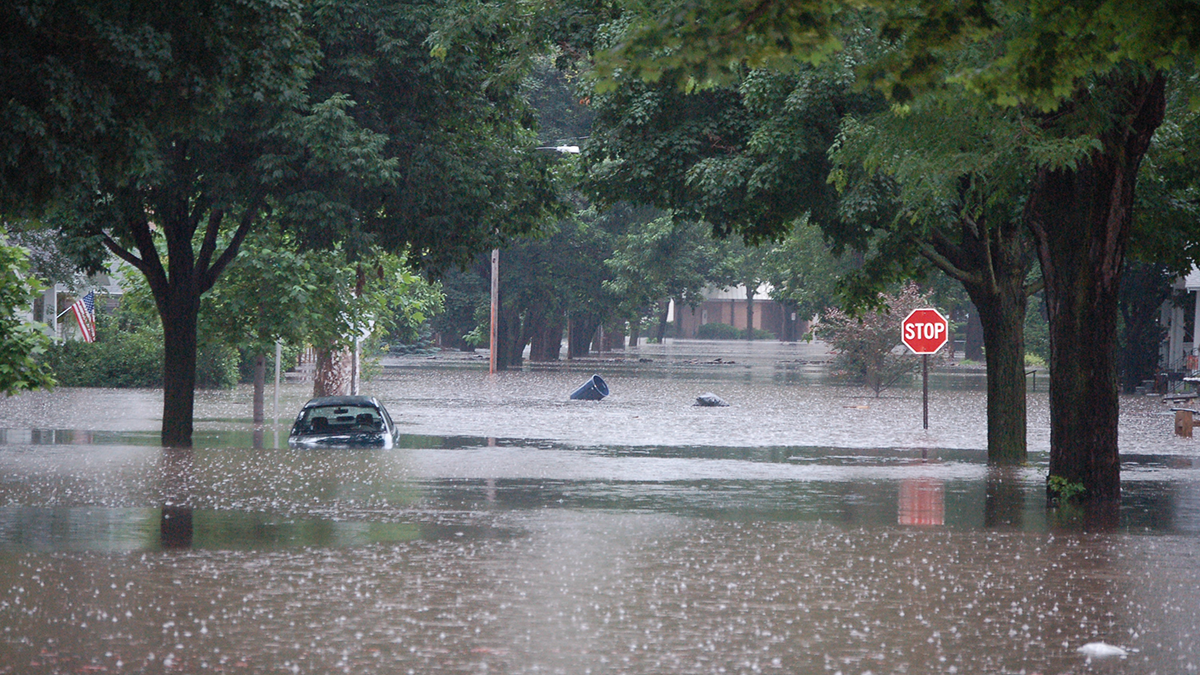
Unlocking the Secrets of Floods: Breakthroughs in Riverine and Coastal Modeling
To enhance flood modeling, it is imperative to gain a comprehensive understanding of the causative mechanisms and cutting-edge models and tools, while also acknowledging their uncertainties.

Posted inEditors' Highlights
A New Look at the Changing Water Cycle Over Land
Whether warming increases or decreases, rain over land depends on the relationship of soil moisture, evaporation, and aridity which shape rain regimes.

Posted inEditors' Highlights
An Innovative Approach to Model Complex Hurricane Flood Hazards
A new study shows that it is possible to produce regional assessments of how hurricane flood hazards change due to both evolving storm tides and precipitation rates in a warming climate.
Posted inEditors' Highlights
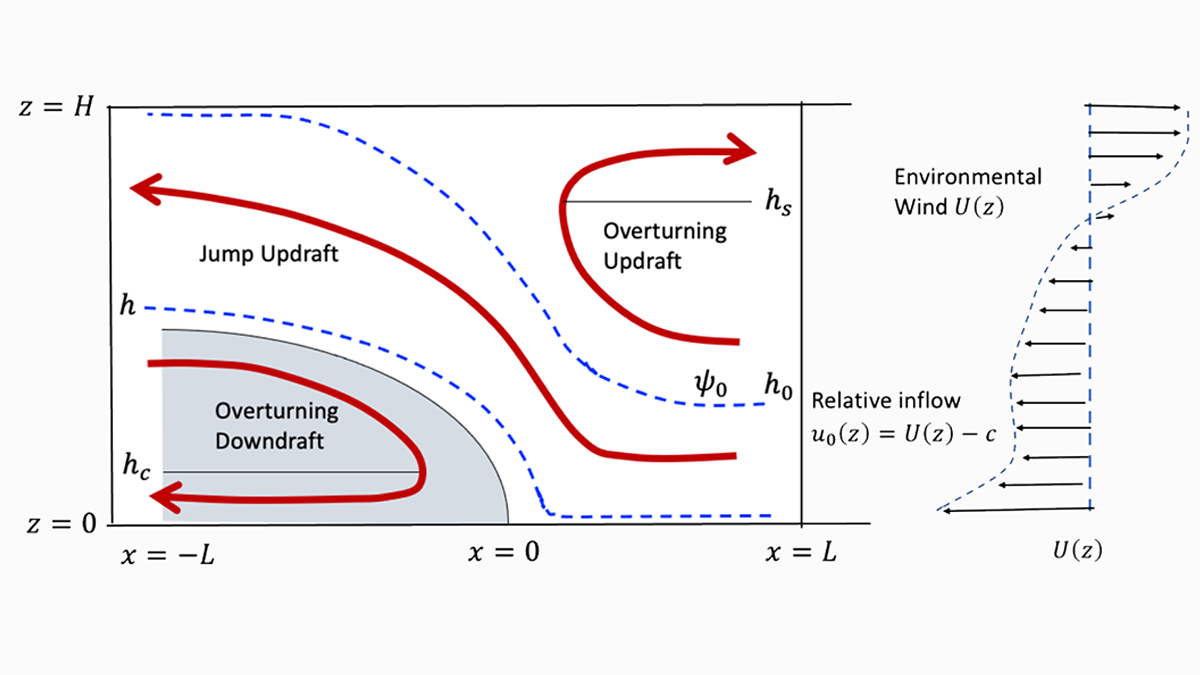
A Theory of Squall Lines
About 50 years ago, vorticity thinking helped unveil basic properties of squall lines. Zhang now provides a closed theory, demystifying one of nature’s most important forms of convective organization.
Posted inResearch Spotlights
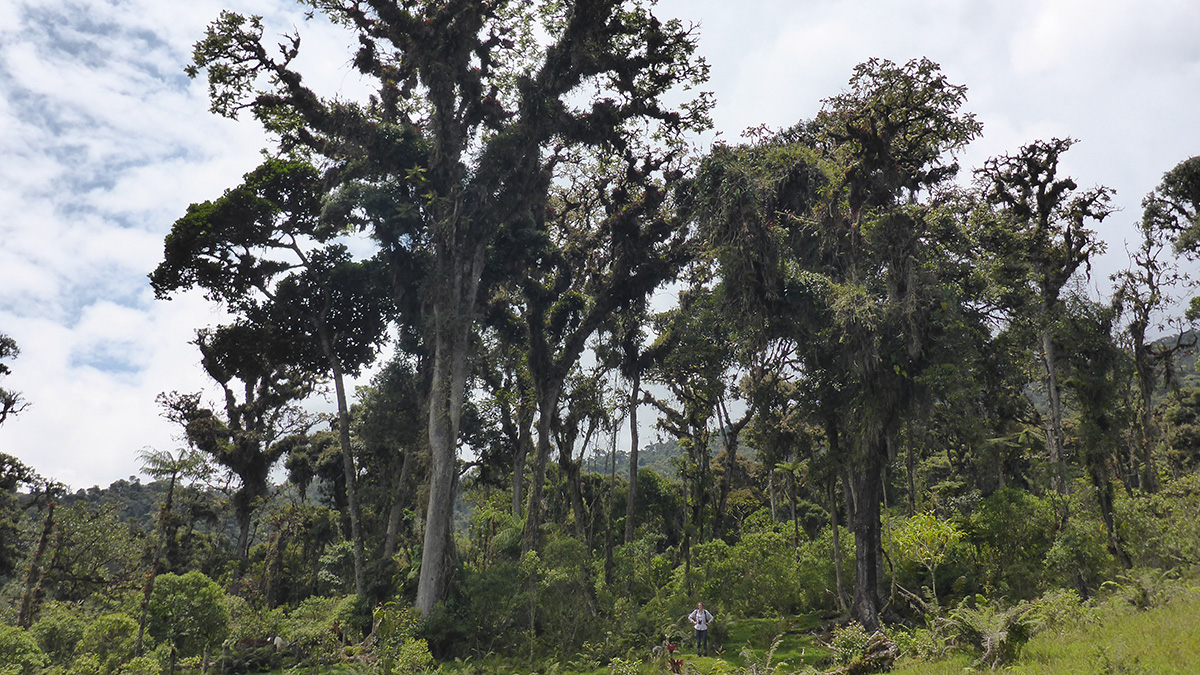
Amazon Basin Tree Rings Hold a Record of the Region’s Rainfall
New research provides a 200-year reconstruction of interannual rainfall in the Amazon basin using oxygen isotopes preserved in tree rings in Ecuador and Bolivia.

Posted inENGAGE, News
Rain Makes Skulls Bigger—in Mice
New research shows how regional weather, shaped by towering mountain ranges, might influence the size and shape of local rodents.