
Satellite altimetry systems keep an eye on Earth’s environment from space, monitoring changes in the heights of ice sheets, glaciers, and forest canopies to record the effects of a changing climate. One such system, NASA’s Ice, Cloud, and land Elevation Satellite 2 (ICESat-2), was launched successfully on 15 September 2018 and is currently collecting critical measurements of the Earth system.
The cutting-edge lidar technology aboard ICESat-2 is optimized for the polar regions, where observations help researchers evaluate the current state of our ice sheets and sea ice. The satellite’s global coverage also delivers high-resolution measurements of tree heights, inland water reservoirs, cloud characteristics, and oceans, improving our knowledge of biomass estimates, water storage, atmospheric heat flux, and sea level. Since ICESat-2’s launch, data not only have met expectations but also provide a window into other potentially transformational science discoveries.
This record is our best opportunity to evaluate changes to the frozen regions of our planet and better predict their evolution under future climate changes.
The original ICESat mission, launched in 2003, provided global altimetry measurements for more than 6 years and contributed to many important scientific studies. These studies quantified the mass loss in ice sheet margins, volume changes of active subglacial lakes in Antarctica, the declining thickness of sea ice in the Arctic Ocean, tropical vegetation heights, and atmospheric characteristics.
Ultimately, ICESat highlighted the need for sustained observations of the polar regions and substantiated the advantages of laser altimetry for other Earth science applications. ICESat-2 measurements will be used with data from ICESat and NASA’s Operation IceBridge airborne program to produce a record of height measurements over land and sea ice spanning more than 2 decades. This record is our best opportunity to evaluate changes to the frozen regions of our planet and better predict their evolution under future climate changes [Markus et al., 2017].
ATLAS Scans the Surface
The sole instrument aboard ICESat-2, the Advanced Topographic Laser Altimeter System (ATLAS), directs laser beams toward Earth’s surface and detects these beams as the surface reflects them back (Figure 1). ATLAS measures the distance between the illuminated surface and the satellite by precisely recording the travel times of the beams. As the satellite orbits Earth, it creates profiles of elevation measurements on the surface. These profiles are repeated every 91 days in the polar regions to enable evaluation of surface elevation changes in the cryosphere.

ATLAS produces a visible green (532-nanometer) laser pulse at 10 kilohertz. This repetition rate allows a surface measurement every 70 centimeters along track. ATLAS laser pulses are split into six independent beams—each with a nominal surface footprint 17 meters in diameter—that are arranged into three pairs. Each pair consists of one high-energy beam and one low-energy beam, and each pair is separated from an adjacent pair by approximately 3.3 kilometers in the across-track direction. Within each pair, the two footprints are separated by 90 meters to facilitate measurement of local slope and to distinguish between regional surface slope and true elevation change over time using repeated measurements—an improvement over the single-beam configuration of ICESat [Neumann et al., 2019].
Over almost 12 months of operations, ICESat-2 has produced more than a trillion laser shots in support of science. Following its launch, the ICESat-2 project office and science team studied preliminary data to assess ATLAS performance and data quality. These analyses validated the capabilities of ICESat-2 for cryospheric studies and also indicated the mission’s broad potential in many diverse areas of study, some of which were unexpected. Here we highlight some of the mission’s preliminary observations and show how the measurements improve knowledge of our planet’s climate dynamics.
Ice on Land and Sea
Sea ice observations are critical for understanding and quantifying the response of the Northern and Southern Hemisphere ice covers to a warming climate. One of these observations is the sea ice freeboard—the height of the snow surface above the local sea surface (Figure 2).
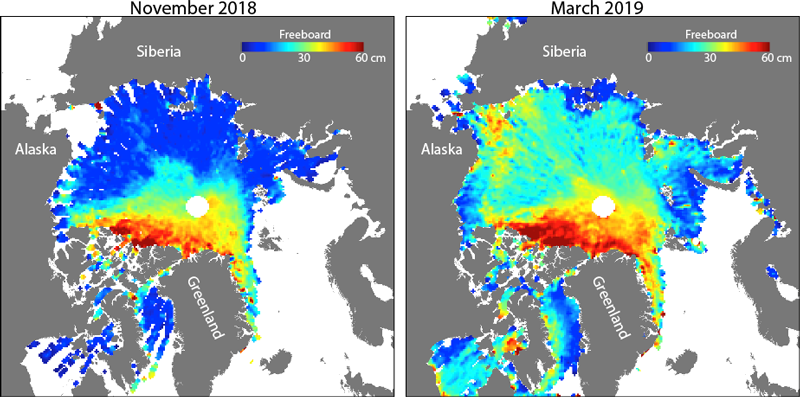
ATLAS allows higher-resolution observations of the exposed sea surface amid the ice cover, which are crucial for freeboard calculations, by resolving narrow cracks, or leads, in the ice that could not be distinguished with previous technology. These freeboard measurements are used to derive sea ice thickness to support investigations of Earth’s energy budget as well as forecasts and projections of change.
Over glaciers and ice sheets, ICESat-2 data have exceeded expectations with their ability to resolve fine spatial features and make early assessments of seasonal height changes.
Ice height measurements are also crucial for determining the current state of Earth’s terrestrial glaciers and ice sheets and to pinpoint where and why changes are taking place. Such measurements are important because the ice sheets store enough water to raise global sea level by more than 60 meters [Fretwell et al., 2013; Morlighem et al., 2017] and because glaciers provide drinking water for much of the world’s population.
Ice shelves are the floating parts of the ice sheet, and changes in their mass lead to loss of grounded ice. Monitoring the ice shelves and the status of rift structures tells us the impact of ocean and atmospheric forcing over time.
Over glaciers and ice sheets, ICESat-2 data have exceeded expectations with their ability to resolve fine spatial features and make early assessments of seasonal height changes that contribute to the 20-year time series. The incredible spatial resolution of ICESat-2 data is highlighted in Figure 3, which shows a transect over a rift on the Filchner-Ronne ice shelf in Antarctica. The data show details of the rift’s structure as well as the changes based on comparison with an ICESat track from 2008.
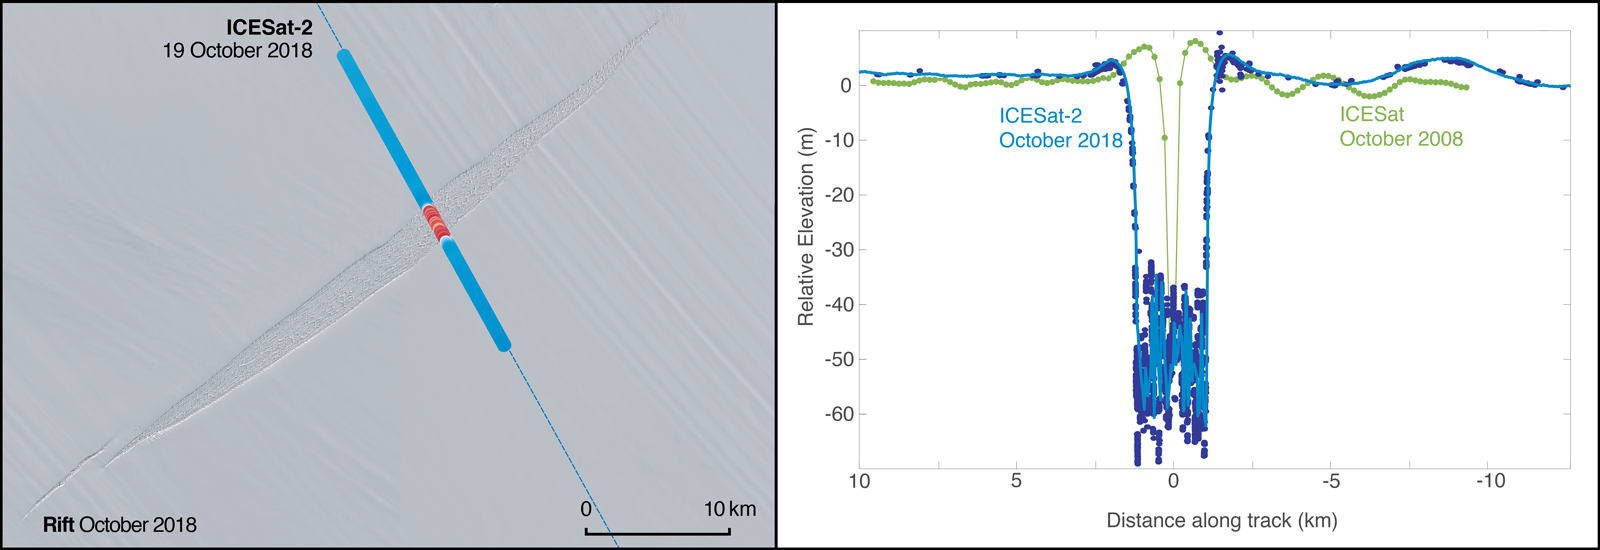
Analyses of preliminary data also show the level of precision possible with the new instrumentation. These analyses suggest that land ice heights determined from repeated ICESat-2 measurements fall within 13 centimeters of each other, and over kilometer-scale lengths the precision improves to within 2–3 centimeters.
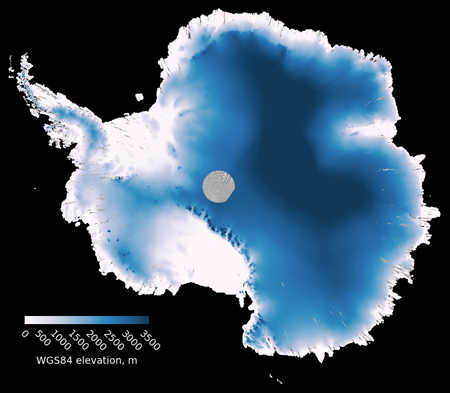
ICESat-2 Antarctic data coverage from the first 5 months of the mission is such that even the northernmost parts of Antarctica have measurements separated by no more than 6 kilometers. Figure 4, which shows the aggregation of the ICESat-2 land ice measurements for October 2018 through February 2019, offers an example of the mission’s thorough data coverage.
Measuring the Forest Canopy
Quantifications of biomass rely on tree height measurements, which are calculated from height differences between the treetops and the ground surface. In some laser measurements, however, the laser energy is absorbed or scattered within the treetops and doesn’t reach the ground surface. Lidar, as employed in ICESat-2, is unique in remote sensing for its ability to provide measurements throughout the full vertical structure of forests. This capability supports studies of terrestrial ecology and vegetation by providing direct assessments of tree heights.
Fortunately, preliminary data have shown ICESat-2’s ability to retrieve information on both canopy top and terrain heights in many types of ecosystems. Figure 5 depicts an ICESat-2 data transect, showing each photon detected. The color scheme indicates the designation of signal and background noise (gray points). This higher-level data product for land vegetation uses additional algorithms to distinguish photons reflected from the ground from photons reflected from the tree canopy (all of the tree branches and leaves) and, specifically, from the canopy top (the maximum tree heights).

Shallow-Water Bathymetry
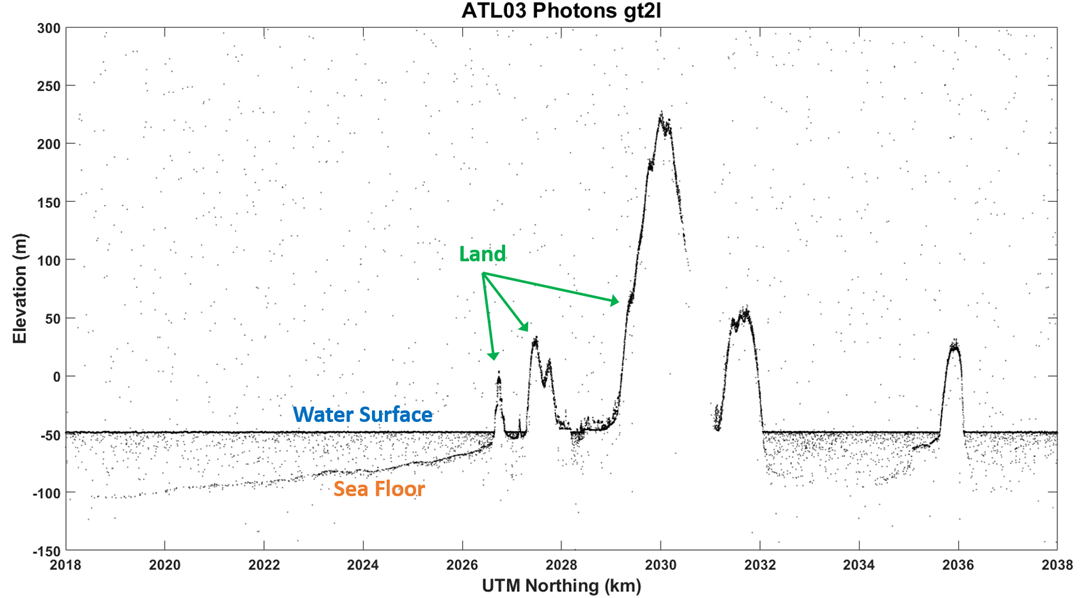
The capability to measure bathymetry in shallow-water environments is potentially transformational: It allows scientists to study coastal regions and coral reef zones and how they are changing. In some conditions, the green light of the ATLAS laser penetrates water for measurement of underwater topography, as shown in Figure 6. This capability will also allow scientists to derive volumes of inland water bodies to help quantify Earth’s global freshwater stores.
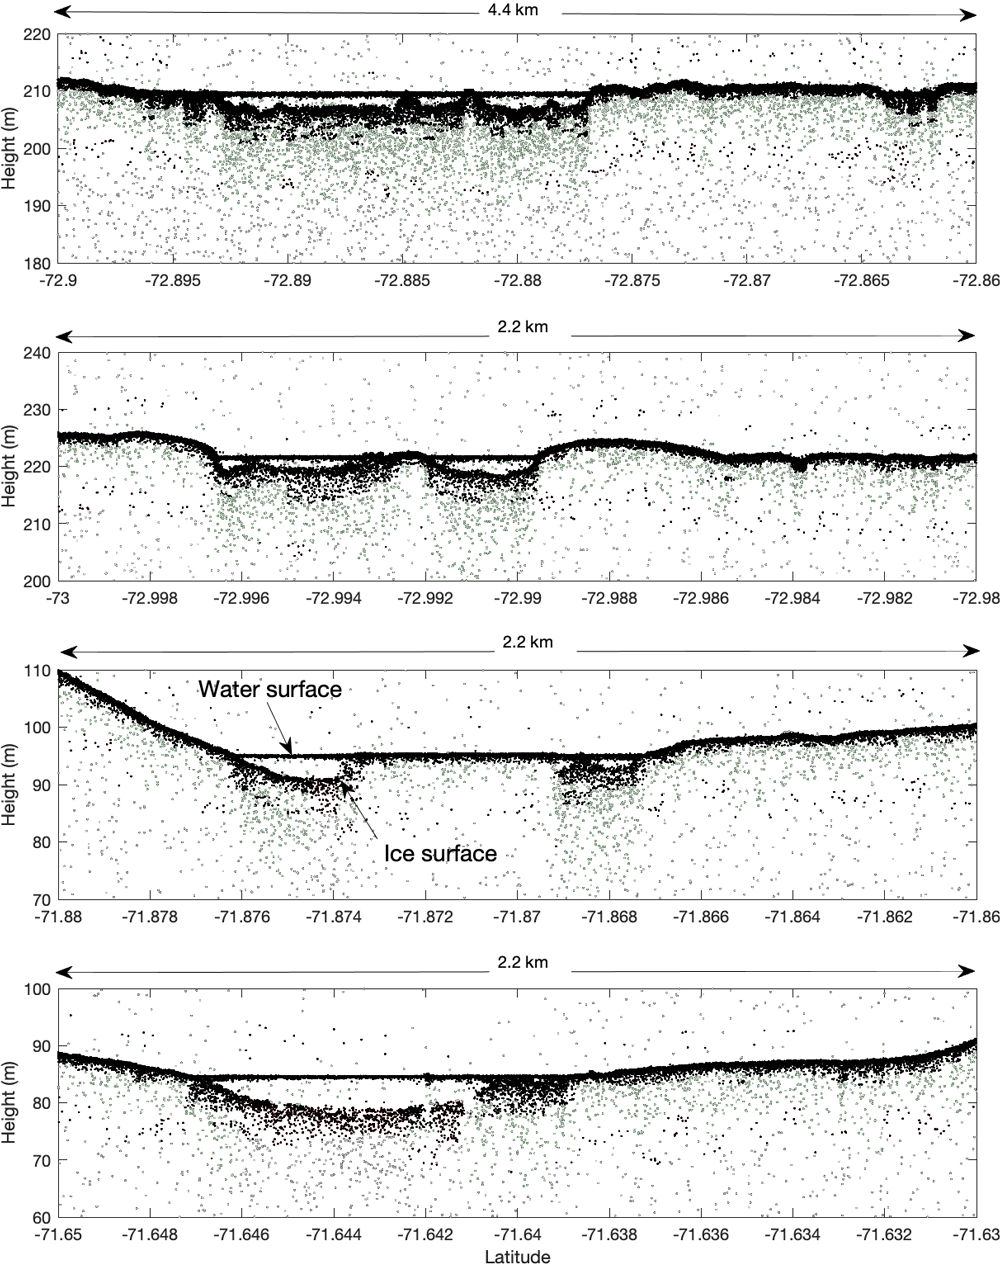
Over ice sheets and sea ice, ICESat-2 photons penetrate surface water in melt ponds that form in some regions during summer; measurements of the depth of melt ponds (water surface minus ice surface; Figure 7) will provide insight into the dynamics of the annual melt season.
Looking Ahead
Since the public release of ICESat-2 data began on 28 May through the National Snow and Ice Data Center, the science community has started exploring this wealth of global height data. We look forward to the numerous collaborations and new insights that will emerge from the availability of these data.
Not only will the precision and resolution of the ATLAS data help create a 20-year record of change in the polar regions, vitally contributing to our understanding and accounting of the effects of climate change, but they will also likely revolutionize our ability to observe change across much of the planet.
Acknowledgments
This update is due to the successful design and development of ICESat-2. The authors recognize all of the scientists and engineers at NASA and present and past members of the ICESat-2 science teams, as well as the NASA Headquarters managers, Thomas Wagner, Charles Webb, and Colene Haffke.
References
Fretwell, P., et al. (2013), Bedmap2: Improved ice bed, surface and thickness datasets for Antarctica, Cryosphere, 7(1), 375–393, https://doi.org/10.5194/tc-7-375-2013.
Markus, T., et al. (2017), The Ice, Cloud, and land Elevation Satellite-2 (ICESat-2): Science requirements, concept, and implementation, Remote Sens. Environ., 190, 260–273, https://doi.org/10.1016/j.rse.2016.12.029.
Morlighem, M., et al. (2017), BedMachine v3: Complete bed topography and ocean bathymetry mapping of Greenland from multibeam echo sounding combined with mass conservation, Geophys. Res. Lett., 44(21), 11,051–11,061, https://doi.org/10.1002/2017GL074954.
Neumann, T. A., et al. (2019), The Ice, Cloud, and land Elevation Satellite-2 mission: A global geolocated photon product derived from the Advanced Topographic Laser Altimeter System, Remote Sens. Environ., 233, 111325, https://doi.org/10.1016/j.rse.2019.111325.
Author Information
Lori Magruder ([email protected]), Applied Research Laboratories, University of Texas at Austin; Tom Neumann, NASA Goddard Space Flight Center, Greenbelt, Md.; Helen Amanda Fricker, Scripps Institution of Oceanography, La Jolla, Calif.; Sinead L. Farrell, University of Maryland, College Park; Kelly M. Brunt, NASA Goddard Space Flight Center, Greenbelt, Md.; also at University of Maryland, College Park; Alex Gardner, Jet Propulsion Laboratory, California Institute of Technology, Pasadena; David Hancock and Kaitlin Harbeck, KBR at NASA Goddard Space Flight Center, Greenbelt, Md.; Michael Jasinski, NASA Goddard Space Flight Center, Greenbelt, Md.; Ron Kwok, Jet Propulsion Laboratory, California Institute of Technology, Pasadena; Nathan Kurtz, NASA Goddard Space Flight Center, Greenbelt, Md.; Jeffrey Lee, KBR at NASA Goddard Space Flight Center, Greenbelt, Md.; Thorsten Markus, NASA Goddard Space Flight Center, Greenbelt, Md.; Jamie Morison, University of Washington, Seattle; Amy Neuenschwander, Applied Research Laboratories, University of Texas at Austin; Stephen Palm, Science Systems and Applications Inc., Greenbelt, Md.; Sorin Popescu, Texas A&M University, College Station; Ben Smith, University of Washington, Seattle; and Yuekui Yang, NASA Goddard Space Flight Center, Greenbelt, Md.
This story is part of Covering Climate Now, a global collaboration of more than 250 news outlets to strengthen coverage of the climate story.
Citation:
Magruder, L.,Neumann, T.,Fricker, H. A.,Farrell, S. L.,Brunt, K. M.,Gardner, A.,Hancock, D.,Harbeck, K.,Jasinski, M.,Kwok, R.,Kurtz, N.,Lee, J.,Markus, T.,Morison, J.,Neuenschwander, A.,Palm, S.,Popescu, S.,Smith, B., and Yang, Y. (2019), New Earth orbiter provides a sharper look at a changing planet, Eos, 100, https://doi.org/10.1029/2019EO133233. Published on 20 September 2019.
Text © 2019. The authors. CC BY 3.0
Except where otherwise noted, images are subject to copyright. Any reuse without express permission from the copyright owner is prohibited.