
A translation of this article was made possible by a partnership with Planeteando. Una traducción de este artículo fue posible gracias a una asociación con Planeteando.
Last month, Antarctica had one of the most significant ice shelf collapses since Larsen B in 2002.
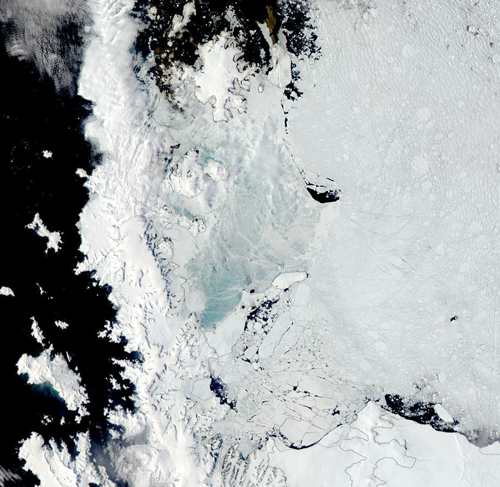
The Hong Kong–sized Conger ice shelf in East Antarctica fell apart abruptly in late March. The collapse happened shortly after a blast of warm air shot East Antarctic temperatures 40°C above normal.
Right before the collapse, a particular kind of storm—an atmospheric river—swept over the continent, and scientists suspect that the storm played a role. The Conger ice shelf “was already on its way to collapse, and it looked like this could have been the final kicker for that,” said Jonathan Wille, a polar climatologist and meteorologist at the Université Grenoble Alpes.
Thirteen of 21 calving events between 2000 and 2020 on the peninsula happened within 5 days after an atmospheric river.
Wille is part of a team that released new findings this month on the effects of atmospheric rivers on ice shelves in West Antarctica. Although it’s too soon to tell what exactly led to the collapse of Conger, which is on the other side of the continent and had been disintegrating for years, new research from Wille suggests that atmospheric rivers coincided with many of the past calving events in the White Continent’s most vulnerable region, the Antarctic Peninsula.
The research found that 13 of 21 calving events on the peninsula between August and March during the years 2000 through 2020 happened within 5 days after an atmospheric river.
“When ice shelves collapse, the glaciers which feed into them speed up and contribute more to sea level rise,” said glaciologist and climate scientist Alexander Robel at the Georgia Institute of Technology.
Most ice shelves in Antarctica are thinning, and the Antarctic ice sheet has already contributed about 7.4 millimeters to sea level rise between 1992 and 2020, according to the Intergovernmental Panel on Climate Change.
A Perfect Storm
“This new study indicates that such anomalous melt events are almost exclusively caused by atmospheric rivers.”
Atmospheric rivers occur around the world, but they bring a perfect storm to Antarctica’s fragile peninsula. The storms hold vast amounts of moisture and heat and deliver extreme rain, snow, whipping winds, and unusually warm temperatures, causing melting and fracturing on the ice below.
Scientists have a building appreciation of extreme events that can have disproportionate consequences. One study found unusual melting events were necessary to kick off a large ice shelf collapse weeks to months later. “This new study indicates that such anomalous melt events are almost exclusively caused by atmospheric rivers,” said Robel, who was not involved in the work.

The latest study relied on a tailor-made algorithm that detects atmospheric rivers. The researchers studied satellite observations and used a regional climate model to identify 21 calving events on Larsen A and B between 2000 and 2020.
Atmospheric rivers make landfall on the Antarctic Peninsula about 1 to 5 times per austral summer, and of the 21 calving events identified, an atmospheric river preceded 13 of them within 5 days.
The group also analyzed the collapse of Larsen A in 1995 and calving at Larsen C in July 2017 and found intense atmospheric rivers preceding both. The work was published in the journal Communications Earth and Environment this month.
Thwaites Not Threatened by Atmospheric Rivers
Atmospheric rivers help protect the Thwaites Glacier by coating it in snow.
Although the findings are the first systematic study of atmospheric rivers over a 2-decade history on the Antarctic Peninsula, it’s unclear how the findings relate to other regions, including Conger. Even the nearby Wilkins ice shelf, which sits on the peninsula, could not be studied because of clouds obscuring satellite images.
Elsewhere on the continent, Thwaites Glacier, dubbed the Doomsday Glacier, is particularly unstable and could bring 65 centimeters of sea level rise. There, atmospheric rivers protect the ice sheet from surface melt by coating it in snow, said Michelle Maclennan, a Ph.D. candidate in atmospheric and oceanic sciences at the University of Colorado Boulder.
This research shows that scientists need a better understanding of fast-changing events on ice shelves, said glaciologist Helen Amanda Fricker at the Scripps Institution of Oceanography, who was not involved in the work. Doing so is vital for predictive models.
Until then, said Willes, scientists will need to track the effects in real time.
“Now in the future, when we see atmospheric rivers head towards Antarctica, especially the ones that are really powerful, this is something we should pay attention to,” he said. “And see what happens afterwards.”
—Jenessa Duncombe (@jrdscience), Staff Writer