

Public reports of bird sightings form the backbone of many biodiversity conservation efforts. Yet in the United States, most crowdsourced bird-watching data come from historically white, affluent neighborhoods and are significantly lacking in historically redlined neighborhoods. This legacy of the nation’s racist 20th century housing practices, which was examined in new research, could be shaping today’s biodiversity conservation efforts.
“We find that 100 years later, redlining from 1933 is still one of the major explanations for lower amounts of bird information in areas that were previously redlined,” said Diego Ellis Soto, who led the new research. This is an environmental justice concern, he added, and one that is missing in conservation decisionmaking.
“More just and equitable representation and access to nature for U.S. citizens and residents sits at the cornerstone of federal policy,” said Ellis Soto, a doctoral student in ecology and evolutionary biology at Yale University in New Haven, Conn. “And right now, there’s a huge blind spot.”
The Birds Are There, but the Data Aren’t
In the 1930s, the Home Owners’ Loan Corporation (HOLC) appraised neighborhoods on their perceived investment security by using a ranking system of A (green), B (blue), C (yellow), or D (red), where D was the worst. The boundaries reflected the race and socioeconomic status of residents, wherein poorer neighborhoods and neighborhoods of color disproportionately received C or D grades and whiter and more affluent neighborhoods received A and B grades. The impacts of this racist housing policy, colloquially known as redlining, persist today in continued housing segregation, wealth inequality, health disparities, and unequal access to green spaces and its benefits.
Ellis Soto and his colleagues wanted to understand how historic race-based zoning practices have also influenced our understanding of urban biodiversity. The group chose reported bird sightings as their metric, he explained, because they comprise the majority of biodiversity data.
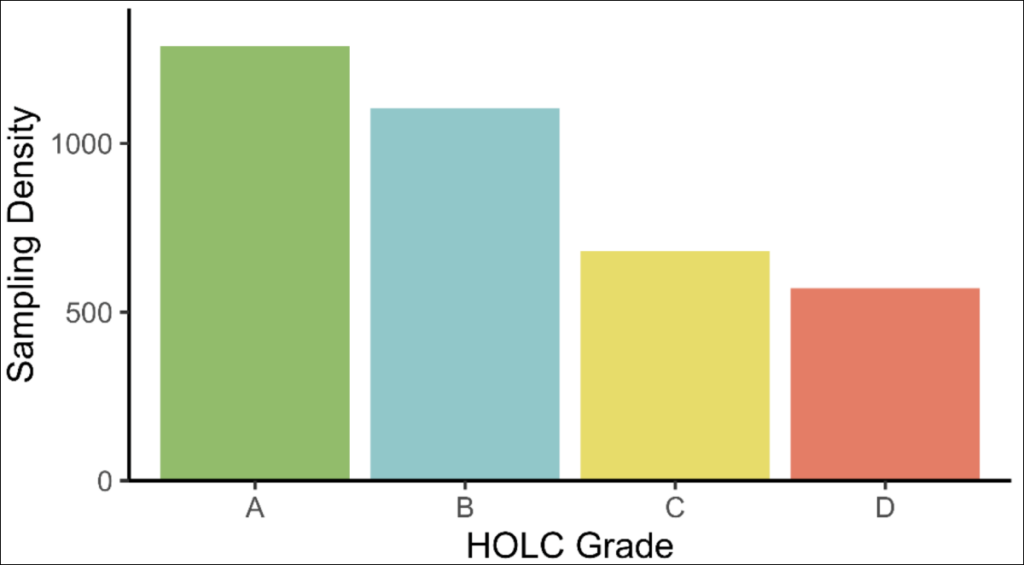
Formerly A-graded areas had more than twice the sampling density as formerly D-graded areas.
“Birds are by far the best studied organisms on Earth, because one of the biggest hobbies related to the outdoors is bird-watching,” Ellis Soto said.
The researchers gathered nearly 12.3 million georeferenced bird biodiversity reports from 1932 to 2022, including those submitted by the popular birding app eBird. They cross-referenced those records with nearly 10,000 HOLC-defined neighborhoods across 195 U.S. cities, calculated bird sampling density and completeness, and carefully accounted for the amount of green space in each neighborhood to evaluate bird biodiversity evenly across disparate urban environments.
In cities across the country, formerly A-graded areas had more than twice the sampling density as formerly D-graded areas (roughly 1,600 per square kilometer compared with about 700 per square kilometer). Thirteen percent of D-graded areas had no bird records compared with 8% of A-graded areas, and C- and D-graded areas had the largest number of biodiversity cold spots.
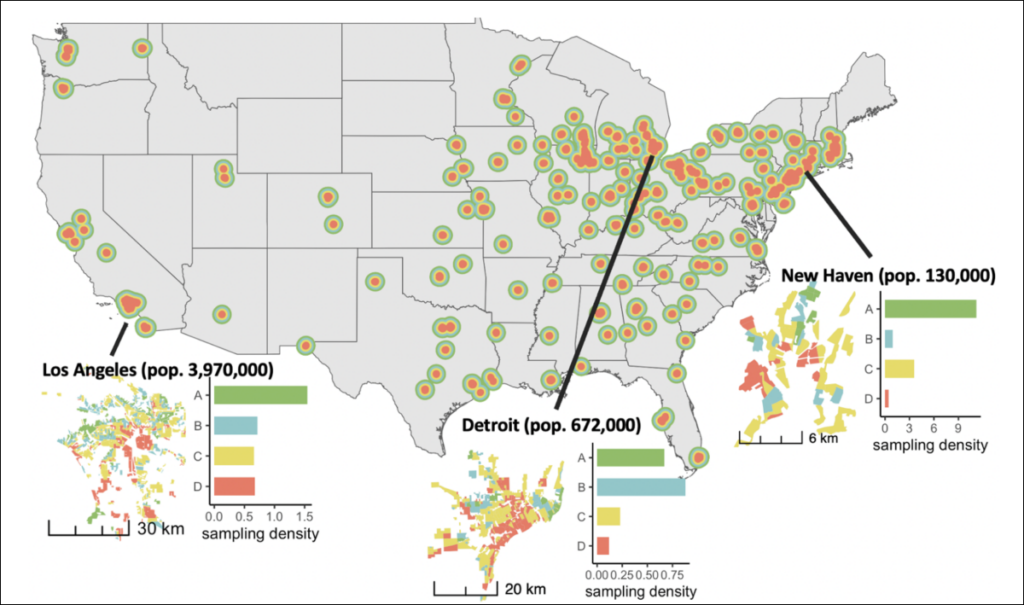
“Overall,” the team wrote, “the rank-order of the HOLC grading system matches the sampling density of bird sampling efforts.”
New Haven, where Ellis Soto lives and studies, presents a clear example of the data gap. On Yale’s campus, there are tens of thousands of reported bird sightings. “If I crossed two traffic lights, I’ll be going to the Dixwell neighborhood, which is a highly segregated neighborhood in New Haven that was previously redlined,” Ellis Soto said. “There is much less data on birds. And this is just 300 meters as the crow flies. No one can tell you that the birds that we have seen on this campus don’t fly 300 meters over there.”
The researchers published these results in Nature Human Behavior in September.
In many cities, historically neglected neighborhoods have been targets of gentrification, receiving influxes of money, new businesses, and housing, often displacing existing residents. This study did not account for gentrification’s effect on data collection, but those neighborhoods, formerly redlined but now more affluent, still stood out as biodiversity cold spots compared with nonredlined areas.
Had they accounted for gentrification, the differences would probably be far starker, Ellis Soto said.
As participation in these data collection efforts grew, formerly redlined areas were left behind.
Moreover, the reporting gap has grown by 36% over the past 20 years, with the advent of crowdsourced bird-watching apps. In other words, as participation in these data collection efforts grew, formerly redlined areas were left behind.
“This lack of sampling leads to numerous issues for bird conservation and human communities, because eBird data [are] often used to guide conservation planning and prioritization,” said Ashley Dayer, who researches the human dimensions of wildlife conservation at Virginia Tech in Blacksburg.
Several recent initiatives of the Biden administration, such as the Justice40 Initiative and the America the Beautiful Initiative, authorized federal and state governments to direct conservation funding to areas at risk of environmental degradation, with a focus on historically neglected areas. These programs use EPA’s Environmental Justice Screening and Mapping Tool, which considers factors such as air quality, Superfund proximity, and clean water.
“How can we protect what we don’t even know we have?”
But the EPA tool lacks biodiversity metrics, so policymakers rely on statistical models of biodiversity to direct funds to areas at risk of species loss. “A record of where a bird is in space and time, that’s the first building block of biodiversity,” Ellis Soto explained. Knowing where birds really are and not just assuming their location based on inequitably collected data, he said, will be critical to preserving urban biodiversity.
After all, the scientists wrote, “How can we protect what we don’t even know we have?”
The Need to Broaden Birding
Dayer’s past research found that “eBird participants are disproportionately white (95%) compared to the U.S. population (77%).” She said she suspects that these birders generally don’t live in formerly redlined areas and that while they tend to bird all over, “they might report that they don’t consider or feel comfortable birding in those areas.”
Fixing the problem is not a matter of sending older, white, affluent birders into undersampled areas, Ellis Soto and his colleagues argued. Educating K–12 students and increasing community engagement in their own neighborhoods is key, they said.
“If you don’t see people who look like you involved in (e)Birding, you won’t think it’s an activity for you, and you won’t get involved.”
Dayer agreed with that assessment. “The solution isn’t necessarily to get the current eBird participants to sample these undersampled areas,” she said. “Participation in birding in general and eBird in particular likely has scientific literacy, physical health, and mental well-being benefits that should be experienced by more than just white, affluent birders.”
“We should focus on addressing why eBird participation is so biased toward white participants and address structural issues and other constraints that limit participation,” she added. “If you don’t see people who look like you involved in (e)Birding, you won’t think it’s an activity for you, and you won’t get involved.”
—Kimberly M. S. Cartier (@AstroKimCartier), Staff Writer
Correction 10 October 2023: A statement about where eBird participants live and bird has been corrected. Because of the timing of the correction, the recording does not include this correction.
This news article is included in our ENGAGE resource for educators seeking science news for their classroom lessons. Browse all ENGAGE articles, and share with your fellow educators how you integrated the article into an activity in the comments section below.