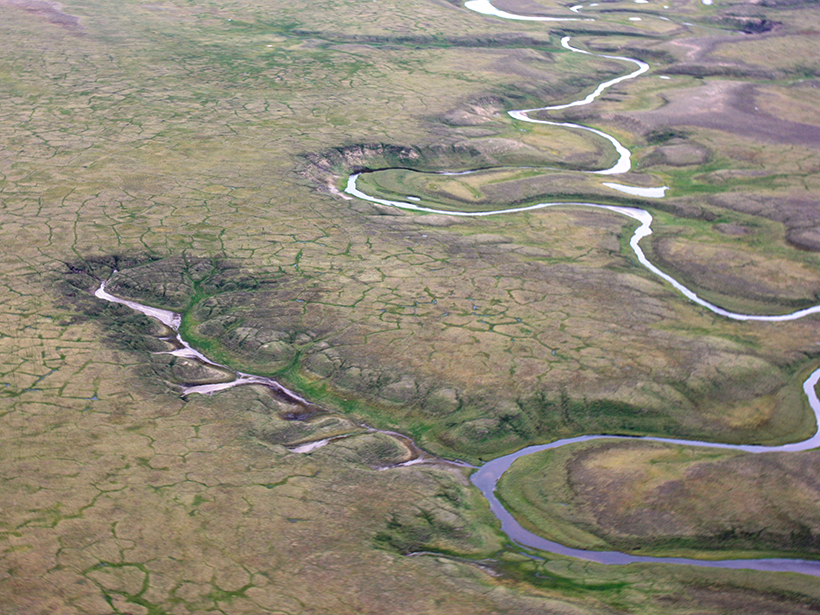
Across the Arctic tundra in summer, vast lakes and wetlands curve across the landscape, painting lazy swirls of blue against brilliant greens of moss, shrubs, and lichens. Within this landscape of hummocks and hollows looms a threat scientists have yet to fully quantify: Huge amounts of carbon, locked into frozen soil for hundreds to thousands of years, are now escaping from the thawing soil and becoming greenhouse gases.

A newly released map may help scientists better comprehend and characterize this threat—its scope, causes, and potential consequences. The map, published last week in Nature Communications, shows scientists where frozen soil could collapse, creating lakes, wetlands, and small hills, collectively called thermokarst landscapes. These areas, some of which already contain thermokarst landscapes, cover 20% of the Earth’s northern circumpolar regions, including the Arctic.
“This map is a first step to answer how the landscape will change with the thawing of permafrost in a warming climate.”
Until now, “there hasn’t been a good map to predict where these features occur in the landscape on a [large] scale,” David Olefeldt, lead author of the 11 October paper and a wetland scientist at the University of Alberta in Canada, told Eos.
“This map is a first step to answer how the landscape will change with the thawing of permafrost in a warming climate,” said Vladimir Romanovsky, coauthor of the paper and a geophysicist at the University of Alaska Fairbanks. “This is the big picture, it is useful as a general idea of what we should expect on a circumpolar scale.”
Collapsing Soil
Soil is full of organic matter in various stages of decay. As this organic matter decays, greenhouse gases like carbon dioxide and methane get released into the atmosphere.
“We know these thermokarst landscape features are often hot spots.”
However, perpetually frozen soils, called permafrost, prevent organic matter from decaying, which traps carbon. Scientists estimate that permafrost locks up 1400 gigatons of carbon—more than twice the amount currently in the atmosphere—and suspect that warming in the Arctic will continue to thaw much of the soil, allowing organic matter to decompose and release greenhouse gases.
Although it’s routine for the top 30–100 centimeters of permafrost to thaw and refreeze seasonally, Olefeldt said, Arctic summers have warmed, which means deeper soil layers thaw out, exposing more and more long-dead plant matter to decomposition by microbes.
When permafrost soils with particularly high ice content thaw, the soil collapses—sometimes across entire landscapes— and underground water seeps upward, creating thermokarst landscapes. Depending on various characteristics such as soil type, ice content, and topography, these landscapes can include wetlands, lakes, or landslide features on hillslopes. The relatively warm water thaws the landscape further, exposing more and more organic matter to microbes and thus more carbon to the air.
“We know these thermokarst landscape features are often hot spots” for greenhouse gas emissions, Olefeldt said. However, scientists have yet to fully incorporate thermokarst into future projections of greenhouse gas emissions, partly because they haven’t known where these features will form on a large scale, he added. This lack of information inspired him and his colleagues to take a closer look.
Mapping Thermokarst
Combining already existing data about soils, topography, conditions of current permafrost regions, and satellite imagery from Google Earth, the researchers built the map. They found that the thermokarst landscapes that cover 20% of the northern permafrost region store up to half of that region’s soil organic carbon, Olefeldt said.
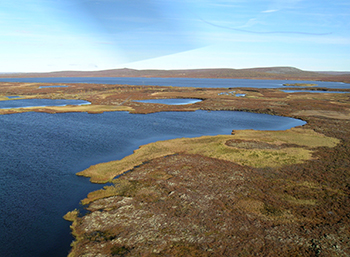
Each type of thermokarst feature requires particular soil types and topography, Olefeldt said. For example, thermokarst lakes, which can cover huge swaths of land like holes in Swiss cheese, require flat terrain with especially icy soil. These lakes also hold the highest potential for methane emissions, he added. Their aquatic, anaerobic conditions allow microbes to slowly break down organic material.

Thermokarst wetlands, another large source of methane emissions, form in flatlands where thick, carbon-rich peat deposits have thawed out. Hilly features like slumps, landslides, and gullies, on the other hand, require slopes of thick soils holding lots of ice, Olefeldt explained.
The mapmakers said they hope that future researchers continue to build on their work, adding to the map detailed knowledge of individual research sites to synthesize a large-scale view of the Earth’s northernmost regions.
—JoAnna Wendel, Staff Writer
Citation:
Wendel, J. (2016), Map reveals hot spots for Arctic greenhouse gas emissions, Eos, 97, https://doi.org/10.1029/2016EO061233. Published on 17 October 2016.
Text © 2016. The authors. CC BY-NC-ND 3.0
Except where otherwise noted, images are subject to copyright. Any reuse without express permission from the copyright owner is prohibited.