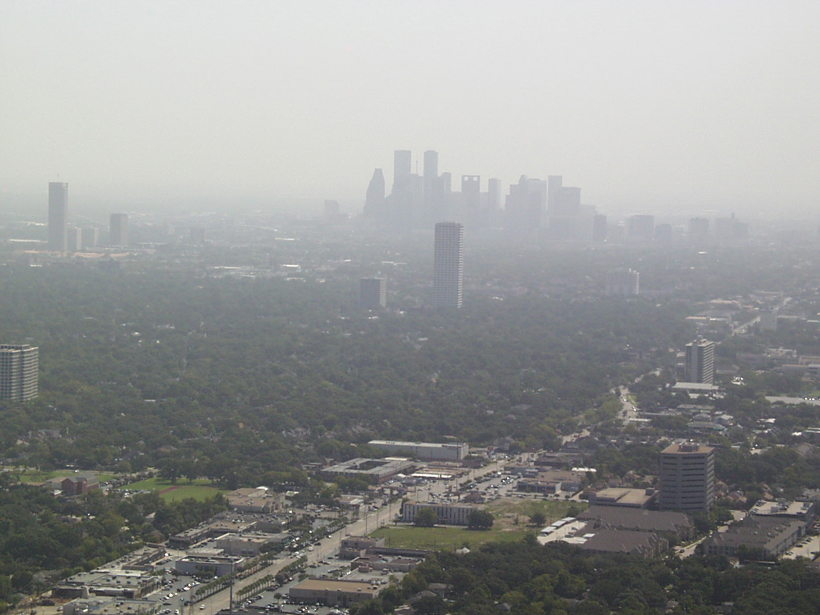
Surface-level ozone—a pollutant and a respiratory health hazard—is declining across most of the globe, but daily maximum averages in parts of North America, southern Europe, and East Asia still regularly exceed air quality standards, according to recently published research.
In contrast, however, “it’s actually going up sharply” in a few places, such as South Korea and Japan, said Zoë Fleming, a research scientist at the National Centre for Atmospheric Science at the University of Leicester in the United Kingdom and lead author on the research paper.
The researchers provided the most comprehensive global maps to date of present-day tropospheric ozone.
Fleming and her team calculated surface-level ozone concentrations in urban and rural areas around the world, focusing on the types of measurements that are often used by health professionals to study harmful effects of ozone in this region of the atmosphere. The study yielded the most comprehensive global maps to date of present-day tropospheric ozone and also showed how the levels have changed over a 15-year period, according to Fleming.
Global Ozone Monitoring
Ozone in the stratosphere shields Earth from harmful radiation, but the gas can form near the surface when sunlight triggers chemical reactions between nitrous oxides and volatile organic compounds. At high concentrations, the pollutant can cause adverse environmental, agricultural, and human health effects. Toxicologists and epidemiologists have linked short- and long-term ozone exposure to a range of respiratory and cardiovascular health conditions, including asthma, inhibited lung development, and, in some cases, death. Fleming said that she and her colleagues wanted to provide an analysis of current tropospheric ozone concentrations and how they’ve changed over time, aiming for data that others might use to evaluate regulatory policies and human health impacts.
“For the first time, we can finally compare all of the sites around the world in a single map, and that was never possible before.”
With that goal in mind, they turned to the Tropospheric Ozone Assessment Report’s (TOAR) surface ozone database, an open online catalog developed by the International Global Atmospheric Chemistry (IGAC) Project. TOAR’s surface ozone database stores records from more than 4,800 ozone-monitoring sites around the world. It also calculates ozone metrics used by toxicologists, epidemiologists, and air quality managers to assess the potential for ozone-related health impacts.
“For the first time, we can finally compare all of the sites around the world in a single map, and that was never possible before,” said coauthor Owen Cooper, a senior research scientist at the University of Colorado Boulder’s Cooperative Institute for Research in Environmental Sciences.
Levels High but Quickly Dropping

The researchers used TOAR to gather health-relevant ozone data from around the globe, including the fourth-highest maximum daily 8-hour average (4MDA8) throughout the year and the number of days with concentrations above 70 parts per billion (ppb), a threshold based on European and U.S. air quality standards above which the team considers the air unsafe. They also created their own universal definitions of “rural” and “urban” regions based on gridded data sets of human population and nighttime lights, a step the team deemed critical to later assessment of human health impacts.
Using those classifications, the researchers found that present-day ozone concentrations (an average of 2010–2014 values) exceeded 70 ppb for more than 26 days out of the year in rural and urban regions of the western United States, southern Europe, Japan, and South Korea. Ozone concentrations reached more than 100 ppb in subsets of those areas.
Peak ozone concentrations in the eastern and western United States decreased as much as 2 ppb per year, as did levels in eastern and southwestern Europe. The number of days with peak levels exceeding 70 ppb also decreased in those areas.
Peak ozone concentrations in parts of China and Japan, as well as the Korean Peninsula, however, rose more than 2 ppb per year over 2000–2014, and the number of days with peak levels above 70 ppb also increased during that time. The researchers published these results in Elementa: Science of the Anthropocene on 5 February 2018.
More Data to Come
This study allows “a rapid understanding of how ozone concentrations, and potentially health effects, are changing throughout the world.”
“This study adds to our knowledge of trends in ozone concentrations that are relevant for health,” said Jason West, “allowing a rapid understanding of how ozone concentrations, and potentially health effects, are changing throughout the world.” West, an associate professor of environmental sciences and engineering at the University of North Carolina at Chapel Hill, was not involved in this research. He said that he plans to use these results and other TOAR-based analyses to improve predictions of surface-level ozone concentrations by global atmospheric models.
Cooper added that future versions of the TOAR databases might track additional pollutants like nitrous oxides and will add data from new monitoring sites as they become available. Fleming said that she and her team hope that future maps will include data from areas of the world not covered by the current data set.
—Kimberly M. S. Cartier (@AstroKimCartier), News Writing and Production Intern
Citation:
Cartier, K. M. S. (2018), Ozone pollution maps show spikes amid broad declines, Eos, 99, https://doi.org/10.1029/2018EO093493. Published on 21 February 2018.
Text © 2018. The authors. CC BY-NC-ND 3.0
Except where otherwise noted, images are subject to copyright. Any reuse without express permission from the copyright owner is prohibited.

