


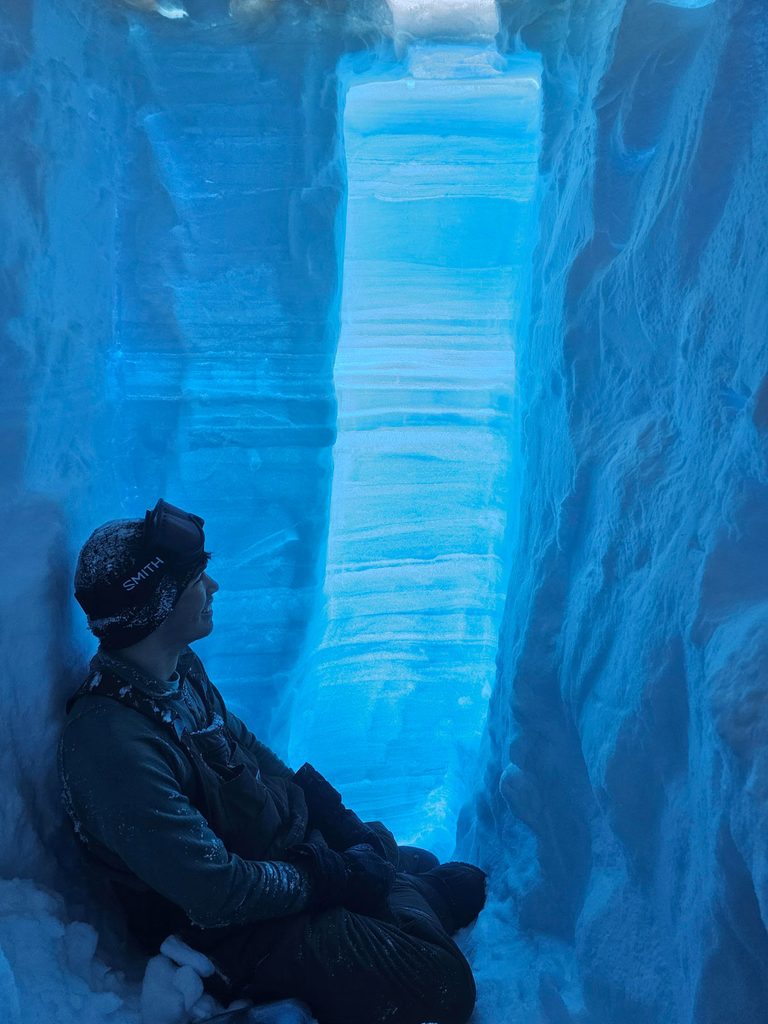
Joe McConnell has been studying ice cores from Greenland, northern Canada, and the Russian Arctic for decades. These cores contain stories about the history of Earth’s climate, including how humans have affected it.
McConnell and his colleagues have long been aware of a rise in levels of bismuth and antimony in these cores dating to the early 20th century. Both metals can be a by-product of anthropogenic activities such as mining, so researchers concluded their presence was likely the result of pollution from the Second Industrial Revolution. But pollution from industry continued—and indeed rose—long after the spike.
“Why did these things peak in the 1910s, 1920s?” wondered McConnell, a climate and environmental scientist at the Desert Research Institute specializing in ice cores. “It didn’t seem to fit.”
A few years ago, McConnell’s lab developed a method for measuring arsenic in ice cores. Arsenic is harder to measure than metals such as lead because it doesn’t have an isotopic signature and is found in such small amounts in ice cores. But like lead, bismuth, and antimony, arsenic can be a by-product of copper smelting.
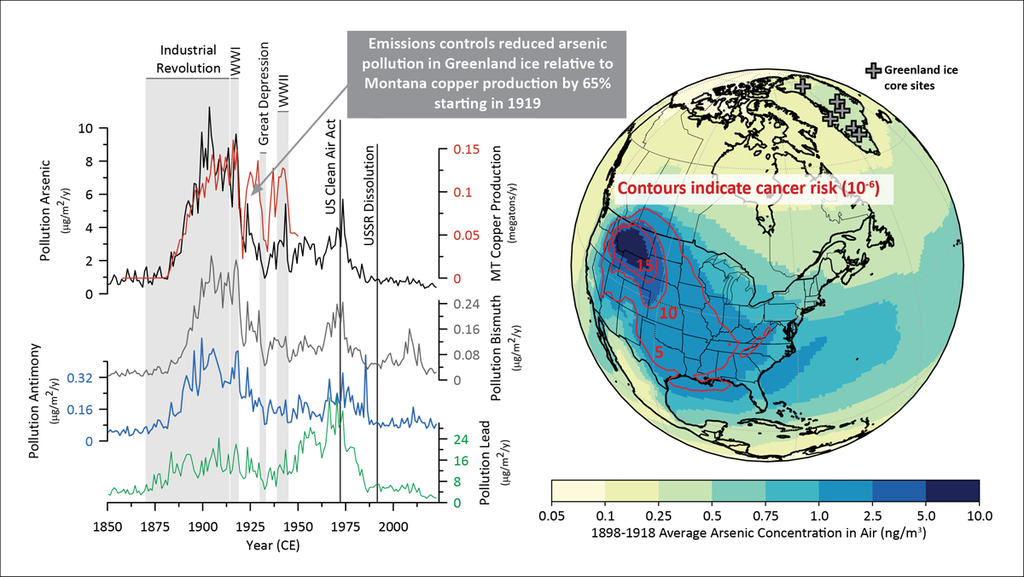
In a new study published today in Nature Sustainability, the researchers used the arsenic information to trace the source of metals in 10 Arctic ice cores back to one dominant origin: the Anaconda Copper Mine in Montana, thousands of kilometers away.
“It’s a really neat piece of detective work.”
“It’s a really neat piece of detective work,” said Karl Kreutz, an Earth scientist at the University of Maine who was not involved with the research. “What they presented [with arsenic] seems pretty convincing to me, that they can trace it back to one major mine in Montana. That’s the first time I’ve seen somebody try to do that with arsenic.”
Delayed Regulations, Delayed Benefits
The installation of electrostatic precipitators on the Anaconda smelter was likely responsible for the reduced pollution levels after 1919, despite the mine’s continued operation until 1947. The study’s findings suggest that the precipitators reduced heavy metal emissions by about 65%. The precipitator was patented in 1908, and its inventor personally designed a plan for how to install one at Anaconda, but the devices weren’t installed at the facility for years.
“Montana government policy at the time was they only had to install pollution controls if it was profitable to the polluter,” McConnell said.
The researchers estimate that this delay in pollution control resulted in an additional 60,000 tons of arsenic and 24,000 tons of lead being released from the mine. By referencing 1910 and 1911 census records and modeling the paths of these particles, the researchers estimated that between 1898 and 1918, about 55% of Americans at the time (50.5 million people) and 11% of Canadians (600,000 people) were exposed to levels of arsenic that increased their risk of lung cancer. About 1.4 million people were likely affected by elevated lead pollution levels. According to the EPA, there is no safe level of lead exposure for children.
These statistics may not be surprising to historians. The Anaconda mine was involved in lawsuits from nearby farmers and ranchers and, eventually, the U.S. Forest Service, which alleged that the mine’s activities were damaging agriculture, poisoning livestock, and destroying forests. Today, the area is home to the country’s largest Superfund site.
“Anaconda, it turns out, was an infamous source of arsenic pollution,” said McConnell.
Working Backward
Heavy metals are particles, not gases, so after just days or weeks of traveling through the air, they fall onto surfaces—whether those surfaces be farmland, city, or Arctic ice. This short atmospheric lifetime means that the time that these pollutants were deposited into ice cores is closely linked to when they were emitted.
“Everything points to northern North America.”
“We used the deposition pattern in that array to identify what region of the Earth the emissions must have come from during this time period, during the Second Industrial Revolution,” McConnell said. “And everything points to northern North America.”
The researchers analyzed U.S. and Canadian records on copper production levels to create a temporal record of emissions. They examined several sources across North America: A smelter in Tacoma, Wash., for example, was excluded as being too small to produce what scientists were seeing in the ice cores. The isotopic ratios of the lead from mining activity in Sudbury, Canada, didn’t line up. And a mine in Michigan’s Keweenaw Peninsula produced mostly native copper, meaning emissions of the heavy metals being studied were relatively low.
When researchers looked at production statistics for the Anaconda Copper Mine, though, they lined up almost exactly with the measured level of arsenic in the ice cores, including a peak of about 15 times higher than preindustrial level levels in 1914.
Franciéle Schwanck Carlos, a geoscientist at Centro Polar e Climático, Universidade Federal do Rio Grande do Sul, Brazil, told Eos in an email that though it is difficult to trace emissions back to one source, the authors seem to have to have shown a good match using their atmospheric transport models.
“In this scenario, the best way to track arsenic sources is to identify the major producers and compare production and emissions with the ice core data,” said Carlos, who was not involved with the research. “The historical production data from the considered areas seems to fit best between Anaconda’s data and ice core measurements.”
—Emily Gardner (@emfurd.bsky.social), Deputy Editor