
Years before the first telescope was invented, sky-gazers made their rooms into pinhole cameras and took pen to paper, drawing the Sun and the little dark spots that moved across its face day by day. Sunspot drawings date back more than 2,000 years to astronomers in ancient China and, many centuries later, to Western scientists like Galileo and Kepler.
Now science historians worldwide have come together to compile and digitize 400 years’ worth of sunspot drawings in the hopes of illuminating solar activity of the past and informing our present understanding. Solar physicist Andrés Muñoz-Jaramillo used this digitized collection of sunspot observations to develop a collection of software tools to analyze solar cycles and reconstruct missing gaps.
“When we think about how much our capability of observing the [solar] cycle has evolved during the past decades—it’s incredible,” said Muñoz-Jaramillo, a senior research scientist at the Southwest Research Institute in Boulder, Colo. “The quality, resolution, cadence, everything.”
Learning from the Past
Solar cycles typically last 11 years, but Muñoz-Jaramillo said that the best instruments for observing the Sun, like the Parker Solar Probe and the Solar Dynamics Observatory, have been around for only about 2 decades. To understand solar variability going back centuries, researchers must look to techniques of the past.
“Whenever we’re dealing with long-term variability, we don’t have the luxury of waiting 100 years to get better data,” said Muñoz-Jaramillo.
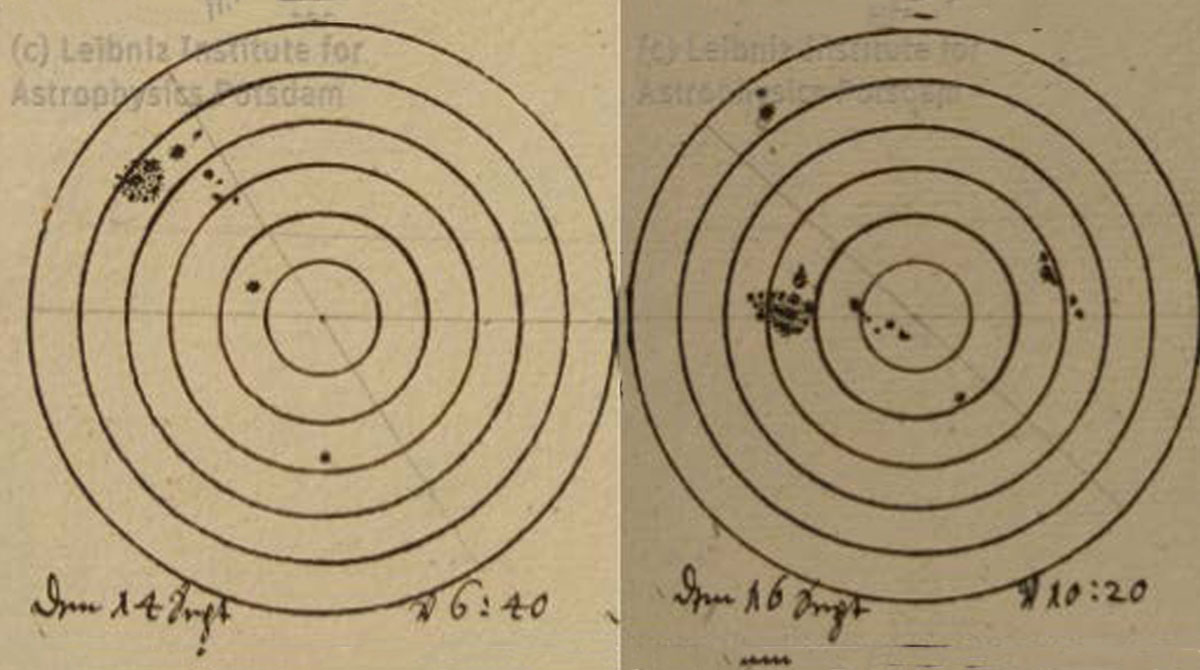
Before the invention of the photograph, astronomers would point a solar telescope at the Sun and use the eyepiece to project the image upon a surface covered with paper. They would sketch the sunspots they observed that day and denote the time and date. Over time, the spots appeared to move across the page and grow or shrink or change shape. Some of these records of solar activity have survived to the present day, often gathering dust in neglected corners of archives.
Historians have been diligently collecting and digitizing centuries of drawings and creating detailed logs of the position and size of spots over time. Researchers are now using these logs to study the long-term variability of the Sun.
“A huge part of this work is done by our historian friends. They are like detectives.”
“A huge part of this work is done by our historian friends. They are like detectives,” said Muñoz-Jaramillo. “The real heroes are those that went from archives to basements and traveled all over the world and talked with people, convinced them to let them in, allowed them to take pictures.”
But hundreds of years’ worth of data are difficult to handle. So Muñoz-Jaramillo and his colleagues developed a computational framework to support the efforts of solar cycle researchers worldwide. This collection of software tools uses Bayesian statistics to fill in the gaps where sunspot data may not be available.
“You can make these statements now in a probabilistic way about what went on in these historical periods,” said Muñoz-Jaramillo.
The researchers used this new framework to learn more about the Maunder Minimum, a time period in the 15th century when the Sun was less active and very few sunspots were observed—a few dozen in comparison to the tens of thousands typically observed. With so few data points, any additional information can help scientists better understand the solar activity of the time, Muñoz-Jaramillo said. They also examined another slow activity period in the late 16th century called the Dalton Minimum and compared recent solar activity to that of previous centuries.
Using this framework, they learned that the Maunder and Dalton Minima might have been preceded by other cycles with deep minima in solar activity spread far apart in time. Some heliophysicists speculate that there may be entire solar cycles’ worth of observations missing, Muñoz-Jaramillo said.
Muñoz-Jaramillo and his colleagues presented these results on 16 December at AGU’s Annual Meeting 2025 in New Orleans.
Spotting the Sun’s Evolution
Solar cycle researchers typically observe cycles with what are known as butterfly diagrams, plots of the time and latitude of sunspots. These plots can be used to understand the long-term variability of the Sun by comparing modern and historic data and noting parallels between them. Researchers can reconstruct past solar cycles using this new computational framework and can analyze them using butterfly diagrams to better understand how the Sun has changed in recent centuries.
“It’s a service to the community. We put all these things together to make it easier for any modern scientist to work with.”
“This study is highly innovative because, until now, reconstructions of past solar activity have relied solely on sunspot counts,” José Manuel Vaquero Martínez, a physics professor at the Universidad de Extremadura who was not involved in the study, said in an email. “In contrast, this approach incorporates not only the number of sunspots but also their positions. In other words, it leverages our understanding of how solar active regions (in this case, sunspots) evolve to reconstruct past solar activity.”
The team hopes their work will enable researchers to tap into the treasure trove of historical data more easily than before, Muñoz-Jaramillo said. “It’s a service to the community. We put all these things together to make it easier for any modern scientist to work with.”
—Daniella García Almeida, Science Writer