Editors’ Highlights are summaries of recent papers by AGU’s journal editors.
Source: Journal of Geophysical Research: Solid Earth
Magnetic mineral populations that recorded the Earth’s magnetic field during distinct stages of rock formation are often juxtaposed on micrometer-to-millimeter scales. This poses significant challenges for extracting reliable paleomagnetic information because standard methods —which measure the bulk magnetic moment of whole samples— cannot distinguish between magnetic minerals with overlapping demagnetization spectra.
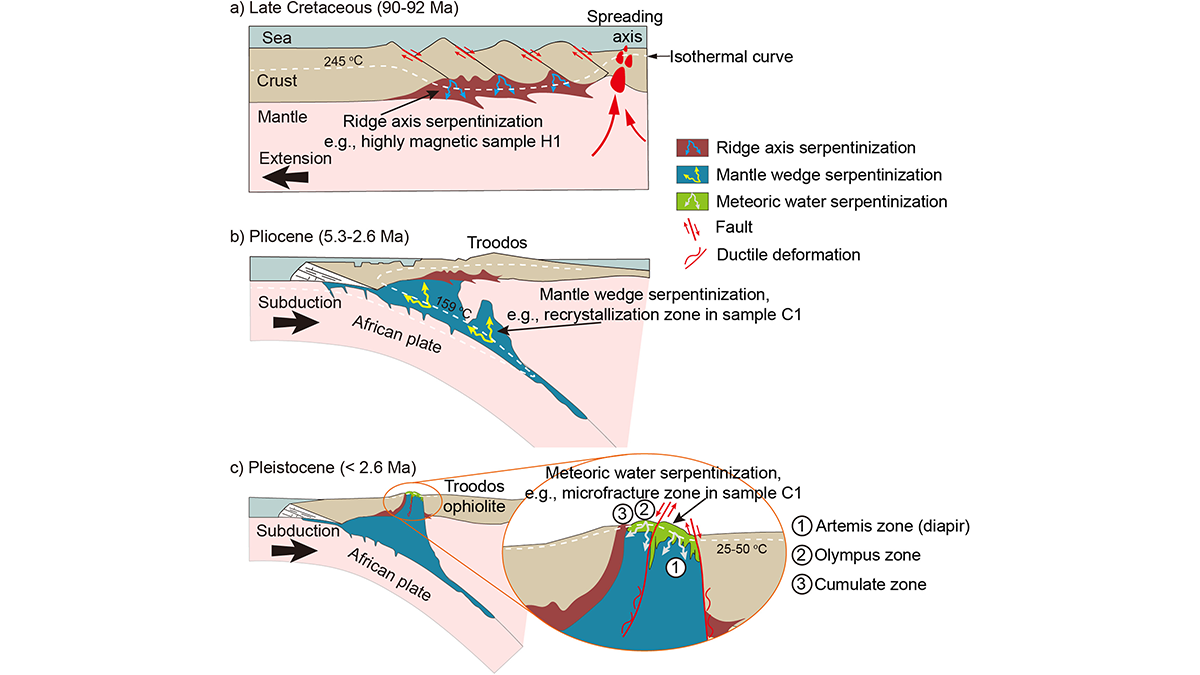
The recently developed Quantum Diamond Microscope (QDM) yield micrometer-scale magnetization images of rock samples, which allow to extract individual magnetization contributions from different structures. Qi et al. [2025] demonstrate the advantage of this new approach with an example from the Troodos ophiolite, Cyprus. QDM measurements of a weakly and a strongly magnetized sample reveal magnetized structures from three distinct serpentinization episodes, from oldest to youngest: ridge-axis serpentinization (strongly magnetized sample, 90-92 Ma), recrystallization zones from mantle wedge serpentinization during subduction (weakly magnetized sample, 5.3-2.6 Ma), and meteoric-water serpentinization following surface exposure (weakly magnetized sample, <2.6 Ma). These episodes are also documented by oxygen isotope measurements indicating distinct alteration temperatures. The QDM technique can be applied to a variety of terrestrial rocks and meteorites with complex magnetization patterns which cannot be disentangled with traditional bulk measurements.

Citation: Qi, L., Muxworthy, A. R., Baker, E. B., Cao, X., Allerton, S., Bryson, J. F. J., & Zhang, Y. (2025). Quantifying serpentinization-driven remagnetization from ridge axis to subduction zone using quantum diamond microscopy. Journal of Geophysical Research: Solid Earth, 130, e2025JB031606. https://doi.org/10.1029/2025JB031606
—Ramon Egli, Associate Editor, JGR: Solid Earth