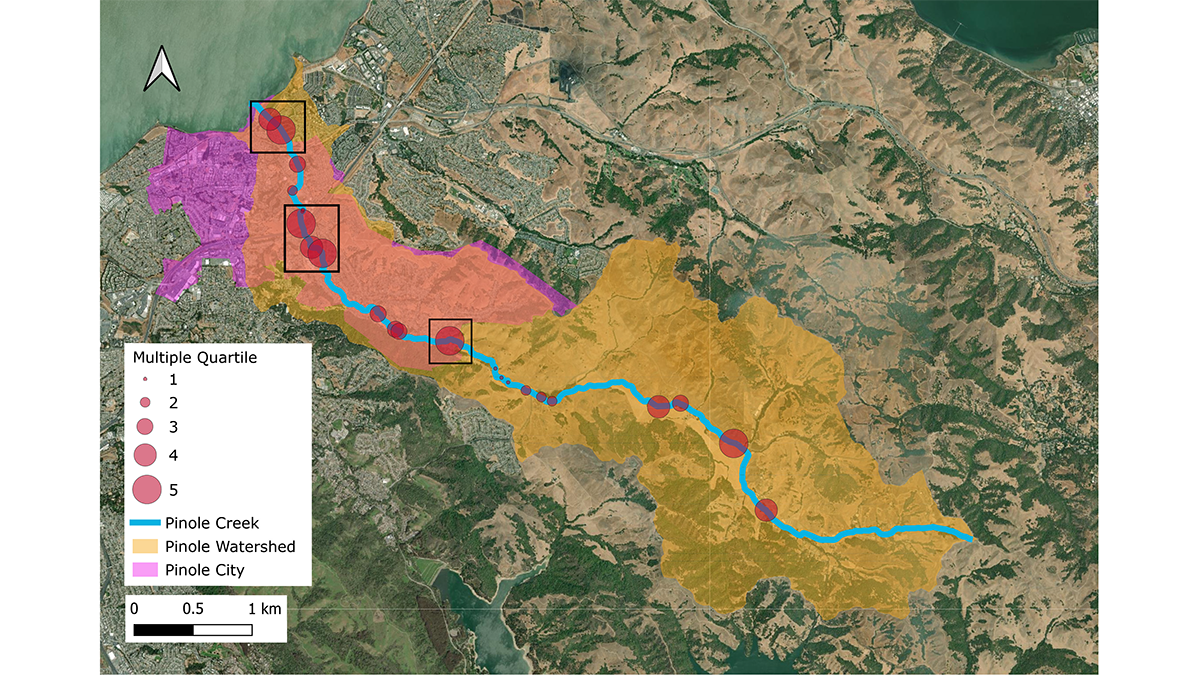
Community effort to systematically count and categorize trash in the Pinole watershed led to the prioritization of locations and trash types that informed recommendations for local government policy.
Editors’ Highlights

Posted inEditors' Highlights
Scotland’s Last Glaciers Cause a Shift in an Old Paradigm
Cosmogenic geochronology of Scotland’s vanished glaciers indicates that the paradigm of weakened North Atlantic currents causing a rapid regional cooling is no longer valid.
Posted inEditors' Highlights
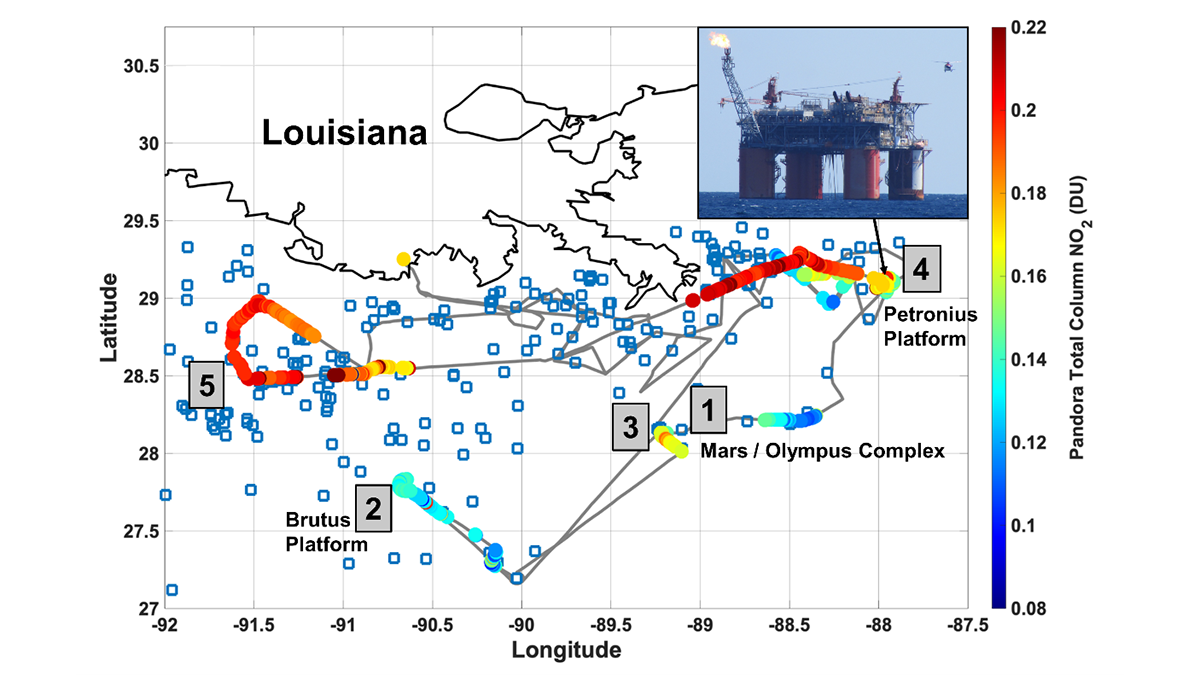
Remote Sensors See NO2 ‘Hot Spots’ from Offshore Oil Activity
Satellites can see NO2 pollution from space, but can they detect individual oil and natural gas operations, and are the measurements accurate?

Posted inEditors' Highlights
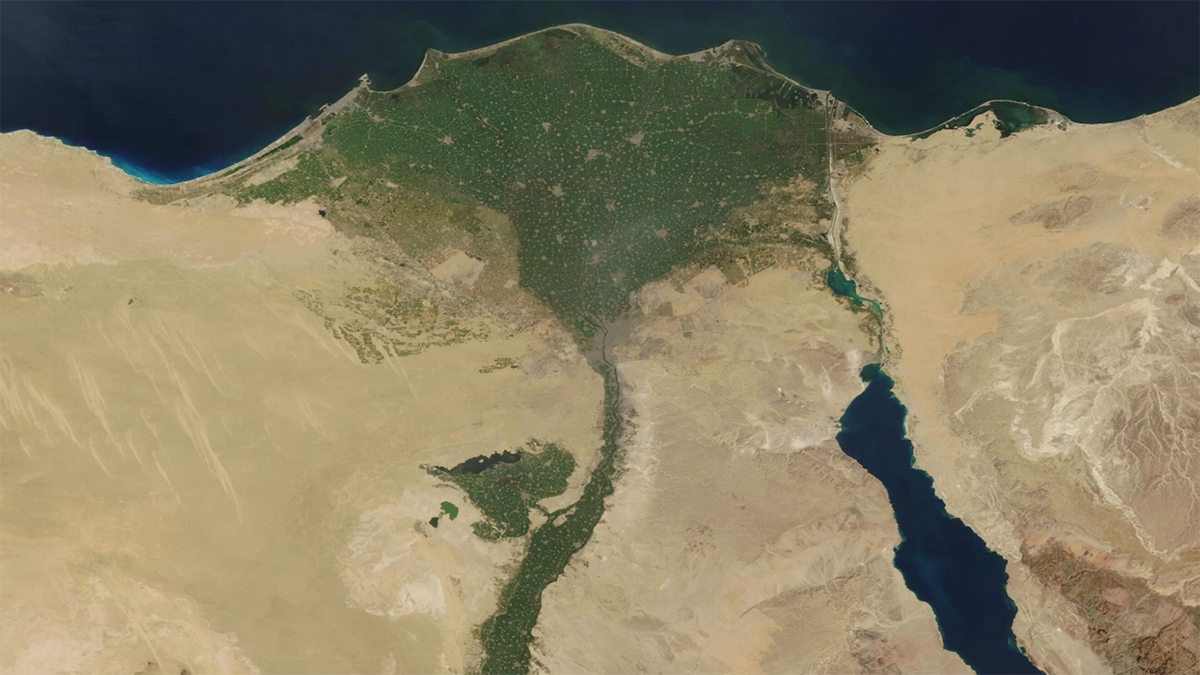
Tracking Heavy Metal Accumulation in the Nile Delta
Sediment measurements show that flow alterations and discharges are driving increasing concentrations of multiple heavy metals in the Nile Delta, threatening ecosystems, agriculture, and human health.
Posted inEditors' Highlights
Suivie de l’accumulation des métaux lourds dans le Delta du Nil
Les analyses de sédiments montrent que la réutilisation de l’eau non traitée et la construction de barrages entraînent l’augmentation des concentrations de métaux lourds dans le Delta du Nil, menaçant gravement les écosystèmes, l’agriculture et la santé humaine.
Posted inEditors' Highlights
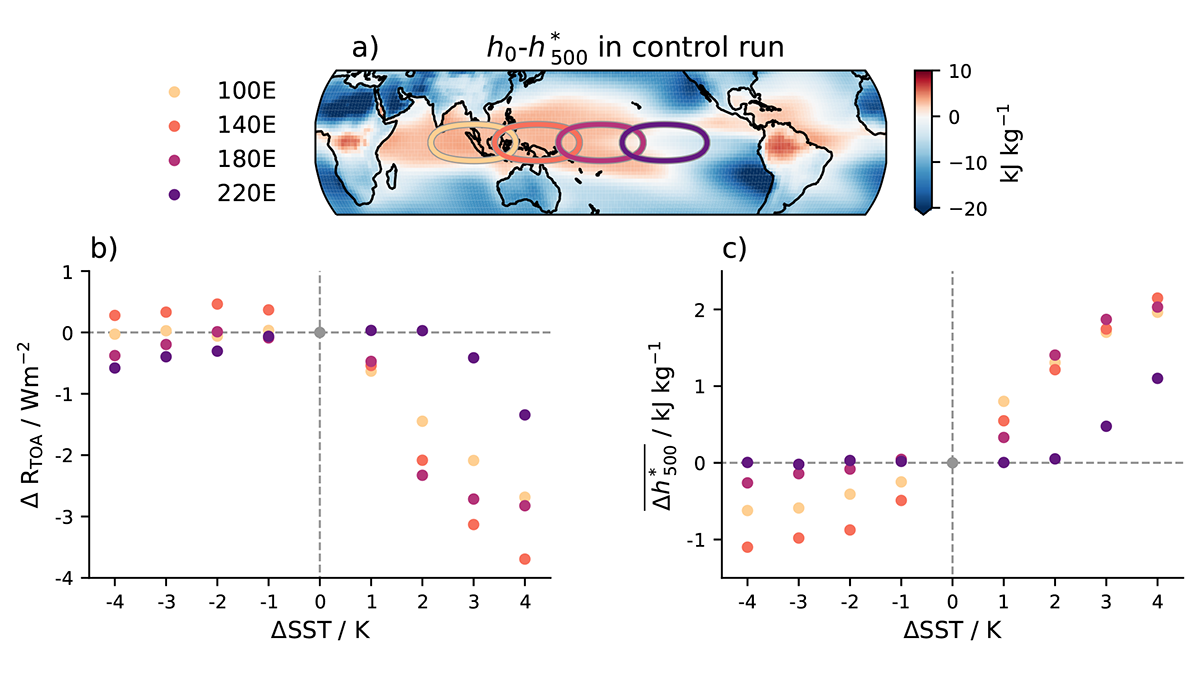
Non-Linear Climate Response to Tropical Sea Surface Temperatures
A new study shows the importance of considering non-linear responses to isolated sea surface temperature (SST) changes and the implications for the linear frameworks used to quantify the SST pattern effect.

Posted inEditors' Highlights
Bio-Argo Floats Reveal Phytoplankton Increase at Ocean Fronts
Bio-Argo floats and satellite altimeter data reveal that upwelling caused by confluent flow on the warm side of ocean fronts increases phytoplankton carbon and chlorophyll.

Posted inEditors' Highlights
Gulf Stream Closes the Valve of the Labrador Current
Virtual particles released in the Labrador Current revealed that the westward penetration of the current into the shelf seas is inhibited by warm core rings emanating from the Gulf Stream.
Posted inEditors' Highlights
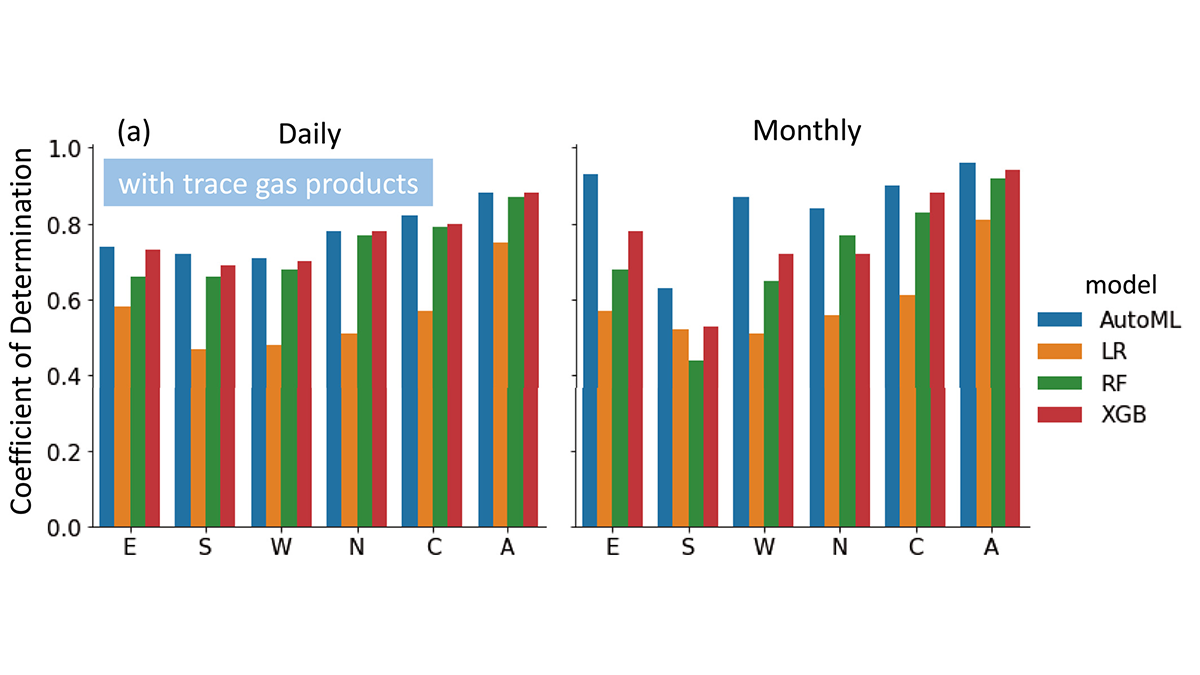
Unleashing the Power of AutoML for Atmospheric Research
Automated Machine Learning liberates domain scientists from selecting learners and hyperparameters and discovers the importance of atmospheric trace gases for improving surface PM2.5 estimates.

Posted inEditors' Highlights
Topography Along the Apennines Reflects Subduction Dynamics
Topography and exhumation vary strongly along the Apennines, reflecting the geometry of the Moho and different geodynamic mechanisms.