Editors’ Vox is a blog from AGU’s Publications Department.
A critical component of undergraduate STEM education is understanding sets of numbers and how to process, plot, and compare them. However, most programs only scratch the surface of data analysis techniques, data visualization, and uncertainty.
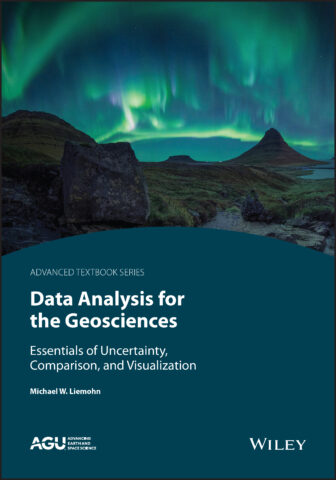
A new book in AGU’s Advanced Textbook Series, Data Analysis for the Geosciences, provides a comprehensive introduction to data analysis, visualization, and data-model comparisons and metrics, within the framework of the uncertainty around the values. We asked the author to give an overview of the textbook and how it can be used.
I’m sure many students grumble about the requirement to take a statistics course. Through your teaching and this textbook, how do you make data analysis interesting and engaging for students?
I introduce this class to students as the broccoli of geoscience. The content is a superfood of analysis and will make you a better scientist, but goes down best with a lot of cheese. In this case, that special sauce is the Earth, atmosphere, space, and planetary examples interspersed throughout the book and the course, not only in the examples we assess in class but also in every homework and exam question. I try to make it real so they see how these obscure statistics concepts could help them with their research projects later in their career.
How is your textbook different from other typical undergraduate statistics and applied statistics textbooks and courses for STEM students?
When introducing a concept, I emphasize which analysis situations are best suited for each statistical technique, and how to decide which one to use in each situation.
I focus the content on understanding the scope of when, where, and how each statistical formula should be used. That is, when introducing a concept, I emphasize which analysis situations are best suited for each statistical technique, and how to decide which one to use in each situation. I only include derivations of the equations so that students can understand limitations of these tools.
There are many statistics equations out there for processing a data set or comparing two number sets, so I strive to be clear about the constraints that we should place on using and interpreting the values we get from these formulas.
Why is it important for all STEM students to know many different tools and techniques for data analysis?
In STEM careers, we make many decisions based on the analysis of a number set or the comparison of two number sets. It is difficult for the human brain to comprehend a list of a million numbers, though, or even a hundred numbers, so this assessment requires the use of techniques to distill an overwhelmingly large set down into a few understandable numbers. We have several common formulas that we love to use, but these come with caveats, embedded in their derivation and therefore critical to their interpretation. If the number set violates that underlying assumption, then our interpretation might be wrong. Furthermore, the decision at the end of our assessment might not fit well with the common metrics, and more appropriate ones should be chosen. It is useful to know about these other techniques to know which one to use for your specific purpose.
What role does uncertainty play in data analysis?
We cannot compare two numbers without knowing the uncertainty of each. If I did an analysis of two supposedly similar data sets, and I found two means of 8 and 10, are these close enough to call them equal? You have no idea without uncertainty estimates. If the uncertainties are 5 and 6, respectively, then yes, an initial guess would be that they are the similar. If the uncertainties are 0.5 and 0.6, however, then no, they are clearly different. Essentially everything about statistical analysis requires an uncertainty estimate to provide context and meaning to the base values.
Why is it important for students to have a strong foundation in data analysis, comparison, and visualization?
To make it personal, essentially all of my research involves the analysis of data sets or numerical model output. Often, I am conducting comparisons of various simulation runs against data for a specific real event or compilations of data across long timescales.
The ability to process a number set through plots, basic statistics, and advanced comparative techniques is at the core of scientific research.
The ability to process a number set through plots, basic statistics, and advanced comparative techniques is at the core of scientific research. A class that introduces students to the number set visualization and comparison is not only essential to a successful STEM career but also useful for critically evaluating statistics that we encounter in our daily lives.
Aside from STEM students, who else may find your book useful?

The process of starting with a plot, then moving on to basic analysis, and finally to more specialized comparative approaches is applicable to many disciplines. For example, it is the basis of engineering analysis of systems and of making financial decisions.
I hope that it is appealing to anyone that compares two number sets across any data science purpose, not only across all of the traditional STEM fields but also in medicine, the social sciences, and economics.
I also hope that that students from other fields find the Earth and space science examples throughout the book to be interesting sidebars about the natural world.
Data Analysis for the Geosciences: Essentials of Uncertainty, Comparison, and Visualization, 2023. ISBN: 978-1-119-74789-5. List price: $149.95 (hardcover), $120.00 (e-book)
Chapter 1 is freely available. Visit the book’s page on Wiley.com and click on “Read an Excerpt” below the cover image.
Find out more about this book in this short video.
—Michael W. Liemohn ([email protected], ![]() 0000-0002-7039-2631), University of Michigan, United States
0000-0002-7039-2631), University of Michigan, United States
Editor’s Note: It is the policy of AGU Publications to invite the authors or editors of newly published books to write a summary for Eos Editors’ Vox.

