In the next in our series of Editors’ Vox that discovers what interesting things AGU journal editors do when they’re not reviewing manuscripts, one of the Associate Editors of Water Resources Research, Jonathan Gourley, answers some questions about why he spends time in rivers prone to flooding.
How did your current field research come about?
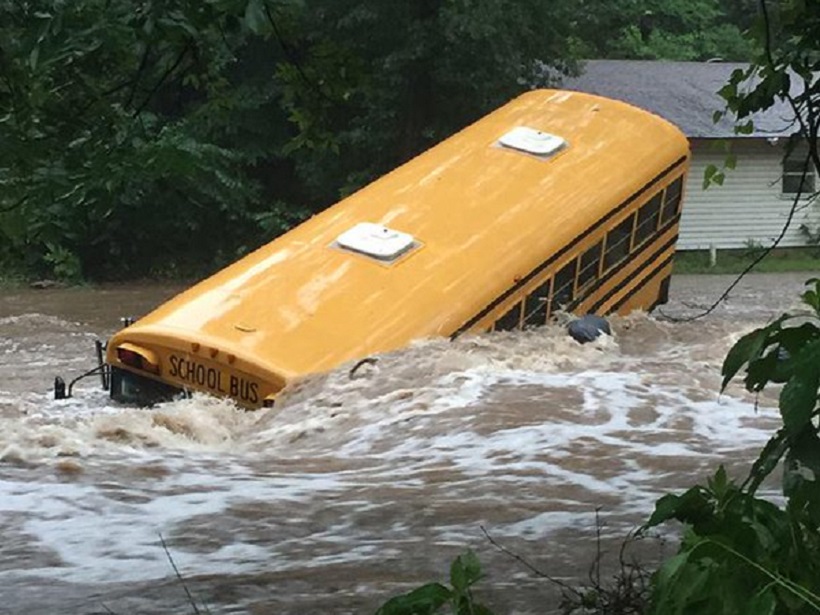
Tens of thousands of young people attend summer camp every year at Falls Creek in the Arbuckle Mountains near Davis, Oklahoma, with as many as 7500 people in camp at any one time. Back in 2015, Tropical Storm Bill caused a devastating flash flood that tore through the camp and isolated hundreds of campers for more than a day. It occurred at night and it was fortunate that no lives were lost.
It is because of incidents like this that I am involved in a project called Automated Non-Contact Hydrologic Observations in Rivers (ANCHOR), a component of which is to install 14 stream radar systems across the United States to detect and monitor flash floods. We installed the first system at Falls Creek Camp in March 2017.

On the evening of 19 May, less than two months after the initial installation, the data logger, which is programmed to send automated alerts when river speed and volume exceeds particular levels, sent a text message indicating that conditions were rapidly deteriorating.
In fact, the river rose from 2 to 12 feet in about an hour. I spent the remainder of the evening communicating with the camp leader and was relieved to receive the final text message: “Thank you. All are well.”
What methods are you using for your project?
Conventional stream gauges for estimating river volume rely on an empirical relationship between the measured “stage” of a river (the depth of the water) and its associated “discharge” (the volume of water flowing through a river channel); this is known as the “rating curve.” The rating curve must be regularly updated with in-situ stage and discharge measurements under varying flow conditions. The major downside is that collecting such data requires regular visits, with associated time and expense.
We have begun the ANCHOR project to explore, evaluate and demonstrate the use of “remote sensing” technologies to estimate stream discharge. The concept works by using commercially available radars that measure the distance between the instrument and the water surface, as well as its surface velocity. This information is combined with the “bathymetry” (channel depth) data measured by a water-penetrating, bank-to-bank scanning LiDAR (Light Detection and Ranging). This technique works without the need for time-consuming and costly measurements to update the rating curve.
What are the advantages of using this kind of technology?
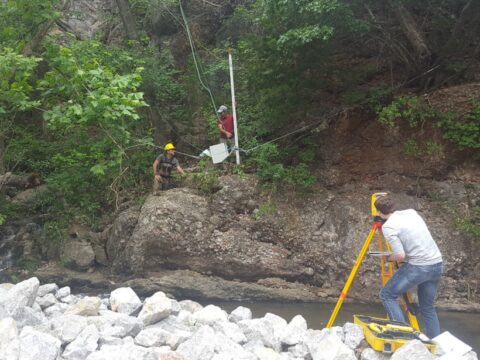
Conventional stream gauges often measure stage with instruments that are in contact with the stream or river. These instruments can be damaged or even lost during extreme flooding conditions. In contrast, remote sensing instruments are situated well above the river channel and don’t come into contact with the water during floods. That said, during the Falls Creek flash flood in May a large tree fell on the cables suspending our radar above the stream and resulted in some damage to the instrument housing, although it continued to collect data throughout the event. During the field excursion shown in the photo above we replaced the radar, as well as surveying high water marks.
What additional data are you collecting at the field site?
Although the purpose of gathering data by remote sensing techniques is to avoid the need to visit locations in person, we have been collecting in-situ measurements at the Falls Creek site to validate the remote sensing measurements. Specifically, we have been using a turbidimeter, a device that measures the water’s cloudiness, or “turbidity” and assess how this might influence the collection of LiDAR data on channel depth.
We have introduced salt upstream and then used a conductimeter to measure conductivity. This is a dilution technique of gauging based on the conservation of mass principle and can be used to accurately calculate discharge.
We have also conducted a number of surveys of the channel cross-section and the high water marks associated with the flood. Lastly, we have used an acoustic Doppler current meter to chart the variability in stream velocity across the stream, along the stream, and with depth.
What will your project contribute to hydrologic, hazard, and remote sensing research more broadly?
At our 14 test sites, we are evaluating the utility of these remote sensing systems. Ultimately, we hope to create a system that provides automated, non-contact discharge estimates and their uncertainties under different conditions. These can not only provide local stakeholders with early alerts of flash floods, but the information can also be fed into flood prediction systems. For example, at Falls Creek in May, our instruments picked up that the water velocity increased about an hour prior to the increase in the river stage, providing much needed time to respond.
Flash flooding poses a tremendous threat to populations and infrastructure. The demonstration of these technologies will hopefully lead to their proliferation so that we can better understand, monitor, and predict the amount of water flowing in our creeks, streams, and rivers.
—Jonathan J. Gourley, Associate Editor of Water Resources Research and NOAA National Severe Storms Laboratory, Oklahoma; email: [email protected]
Citation:
Gourley, J. J. (2017), In pursuit of flash flood data, Eos, 98, https://doi.org/10.1029/2018EO079723. Published on 25 August 2017.
Text © 2017. The authors. CC BY-NC-ND 3.0
Except where otherwise noted, images are subject to copyright. Any reuse without express permission from the copyright owner is prohibited.