

Hurricanes are among the most severe natural hazards on Earth, often inflicting extensive damage and loss of life when they strike coastal communities. Seven of the 10 costliest natural disasters in U.S. history have been hurricanes, and the combination of continued coastal development and climate change will likely only increase the risks they pose and the damage they cause. Storms that intensify rapidly before landfall—such as Hurricanes Harvey, Michael, Laura, and Ida in just the past 5 years—pose particularly serious threats because they often reach major hurricane strength and leave limited time for preparations and evacuations.
The accuracy of hurricane track forecasts has steadily increased over the past several decades. However, intensity forecasts have seen uneven progress and significantly less improvement overall since 1990 [Cangialosi et al., 2020]. Predicting rapid intensification, normally defined as an increase in maximum wind speed of at least 15.5 meters per second (30 knots) in 24 hours or less, remains extremely challenging and is a top research and forecast priority [Gall et al., 2013; Cangialosi et al., 2020]. If we are to continue improving hurricane intensity forecasts, we will need further advancements in our knowledge and understanding of the processes that affect hurricane intensification. We will also need expanded measurements of the ocean and the atmosphere ahead of and within hurricanes, as well as improvements to hurricane forecast models.
Last year, NOAA scientists deployed five uncrewed saildrones in regions of the western Atlantic Ocean and the Caribbean Sea where hurricanes have been historically prevalent. In August, the scientists and pilots in charge of remotely operating the saildrones got a chance to practice positioning them ahead of Tropical Storms Fred and Grace. But the real test came in September as Hurricane Sam headed westward across the Atlantic.
Interactions of Air and Sea
The ocean and its interactions with the atmosphere play critical roles in hurricane intensification, supplying heat energy that is converted into the mechanical energy of a hurricane’s winds. Turbulent heat exchange, called enthalpy flux, between the ocean and the atmosphere depends on sea surface temperature, air temperature, wind speed relative to the ocean surface, and humidity. The rate at which the enthalpy flux increases with increasing wind speed is not well known for hurricane force winds of 35 meters per second and higher [Bell et al., 2012]. The uncertainty is due in large part to a scarcity of direct flux measurements at the ocean-atmosphere interface inside strong hurricanes.
The ocean exerts drag on surface and low-level winds, producing a shearing effect that reduces hurricanes’ intensities. There are many open questions related to the processes that govern the resulting exchange of momentum between the ocean and a hurricane. For low to moderate winds (less than 30 meters per second), it is known that the ocean-atmosphere momentum exchange, or wind stress, increases with increasing wind speed. However, the rate of that change, called the drag coefficient, is less certain for winds exceeding hurricane strength. The drag coefficient is affected by wind speed; by wave age, slope, height, and direction; and likely by smaller-scale features such as sea spray and sea-foam [Holthuijsen et al., 2012]. These processes are very difficult to measure directly in major hurricanes. Changes in the drag coefficient alter a hurricane’s winds, and if those changes are not correct in forecast models, intensity predictions will be less accurate.
Most elements of the sustained global ocean observing system, such as Argo floats, surface drifting buoys, moored buoys, and ship-based measurements, are not optimized for hurricane observations.
Most elements of the sustained global ocean observing system, such as Argo floats, surface drifting buoys, moored buoys, and ship-based measurements, are not optimized for hurricane observations: They sample conditions too infrequently, are spaced too far apart, or cannot be moved into the path of a hurricane [Domingues et al., 2019]. In the past several years, remotely controlled ocean gliders, which profile the upper 1,000 meters of the ocean, have proven to be valuable in collecting hurricane observations from below. The inclusion of glider and other in situ ocean observations in forecast models has been shown to decrease forecast errors, increasing the models’ value for hurricane intensity prediction [Le Hénaff et al., 2021].
The view from above, in the form of ocean-atmosphere measurements from hurricane reconnaissance aircraft, is another central piece of the observational network [Rogers, 2021]. Targeted measurements from aircraft offer high-resolution data within and around specific hurricanes but are limited to a time span of only a few hours.
To help fill gaps in the observations from above and below, continuous measurements of air-sea enthalpy and momentum fluxes at the sea surface are required. These measurements are needed beginning days to weeks before a hurricane’s arrival and continuing as a storm’s eyewall, the ring of clouds and strong winds surrounding the eye, passes by, as well as in its wake. Our goal has been to collect the data needed to start filling these observational gaps.
A Surface Drone Designed for Hurricanes
Engineering and technological advancements in uncrewed surface vehicles (USVs) over the past decade brought us closer to this goal [Mitarai and McWilliams, 2016; Meinig et al., 2019], setting the stage for the experimental 2021 Saildrone hurricane mission. Saildrones are wind- and solar-powered USVs capable of acquiring and transmitting high-quality ocean-atmosphere measurements continuously in real time while traversing some of the harshest and most remote areas of the ocean for a year or more.
The extreme weather–equipped saildrones we used came about through a partnership between NOAA and Saildrone Inc. and emerged from successive rounds of testing and refinement of their design, scientific sensors, and real-time data acquisition and transfer capabilities (Figure 1).
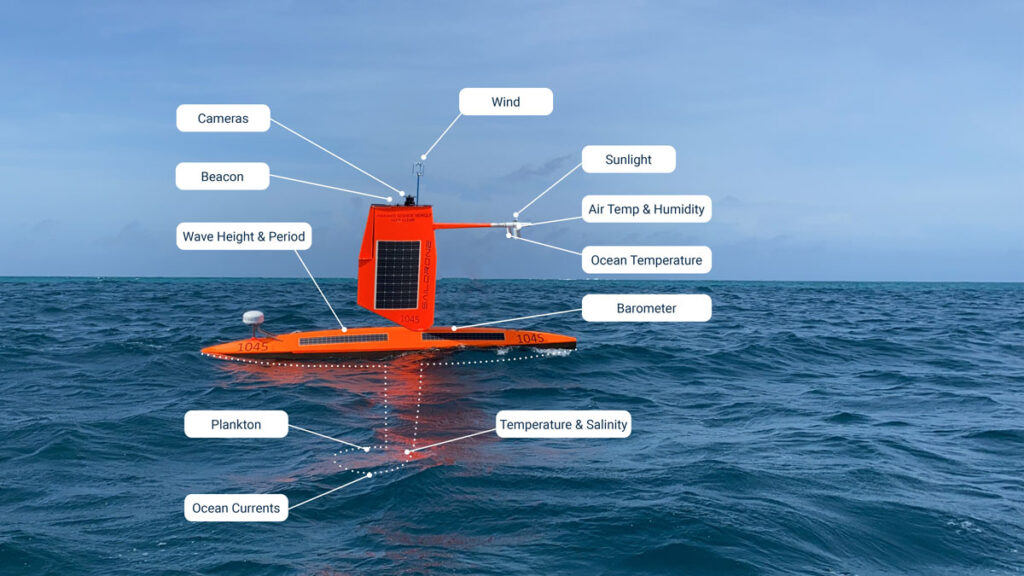
Standard saildrones designed by Saildrone Inc. feature a rigid 5-meter-tall sail and are built for travel speeds of up to 4 meters per second in low to moderate winds. In contrast, the emphasis for the extreme weather saildrones was on survival and transmission of high-quality data while sailing in the large, destructive breaking waves of a major hurricane.
To accomplish this, the sail was shortened to 3 meters, the center of mass of the entire saildrone was lowered to help prevent capsizing, and the durability of the sensors and their housings was improved so they could repel sea spray and survive complete submersion in large breaking waves. After a 3-month test mission in the North Pacific during the winter of 2020–2021, the extreme weather saildrone was ready for a much more challenging test during the peak of the Atlantic hurricane season.
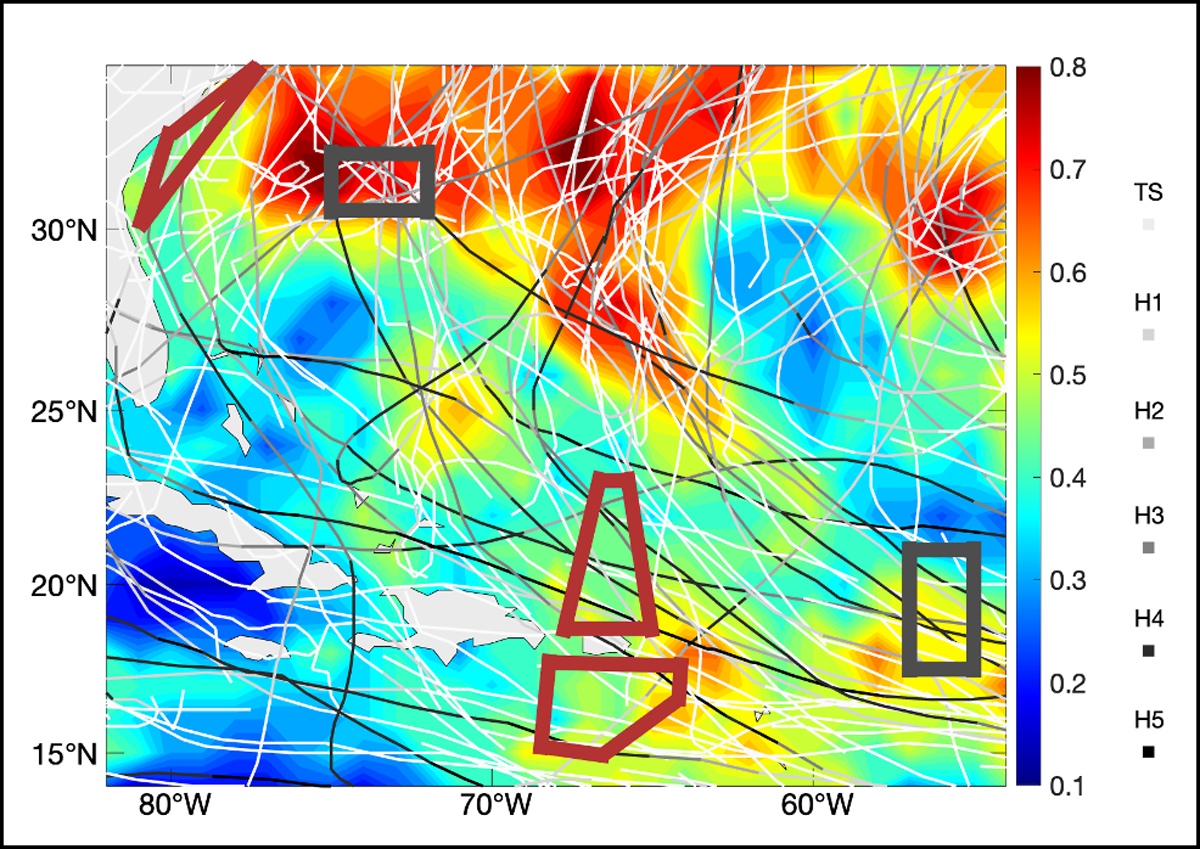
The strategy going into the 2021 mission was to position five saildrones in regions of the western Atlantic Ocean and the Caribbean Sea where, historically, hurricanes have been most likely to travel (Figure 2). During June and July 2021, three of the five saildrones were deployed from the U.S. Virgin Islands, and the other two were launched from Jacksonville, on the Atlantic coast of northern Florida. After initial vehicle and sensor testing, the mission officially started 1 August.
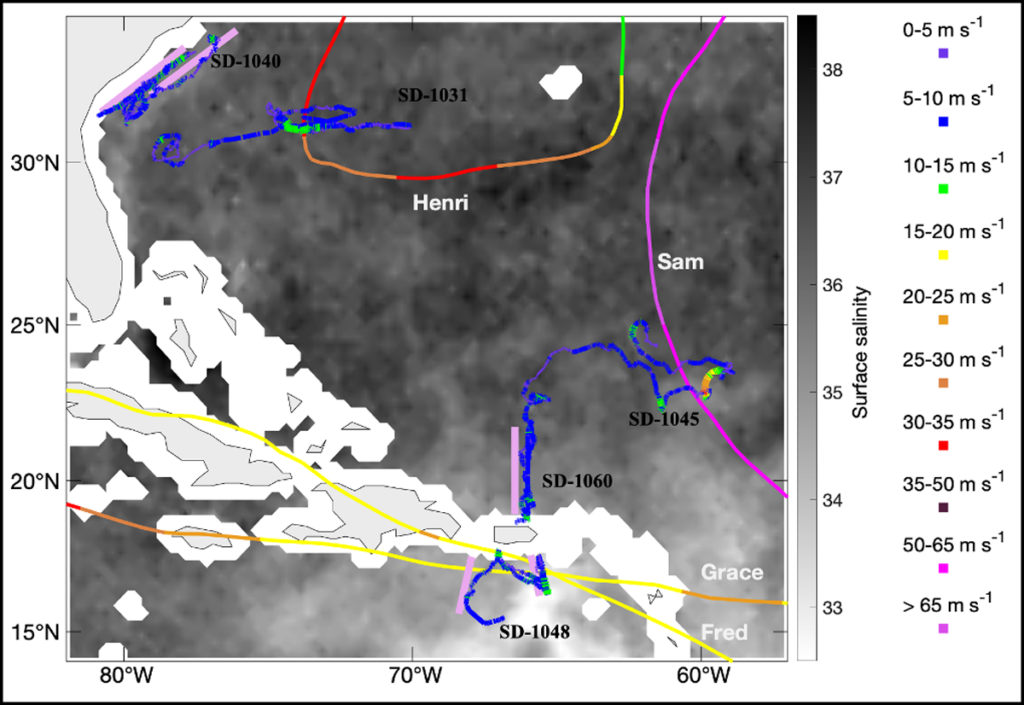
Another goal of our project was to obtain simultaneous and nearly collocated measurements from saildrones and underwater gliders, which continuously measure temperature, salinity, and other ocean parameters in the uppermost kilometer of the ocean [Miles et al., 2021]. Three of the saildrones were thus piloted to follow the paths of ocean gliders (pink lines in Figure 3). Raw data from all the saildrones and gliders were made available to global forecast centers in near-real time through the Global Telecommunication System and to the public through web interfaces.
Chasing Tropical Storms: A Warm-Up for Sam
By mid-August, a trio of tropical storms provided opportunities to practice positioning saildrones ahead of approaching storms.
By mid-August, a trio of tropical storms provided opportunities to practice positioning saildrones ahead of approaching storms (Figure 3). On 9 August, NOAA’s National Hurricane Center (NHC) predicted that a tropical depression would grow near the Lesser Antilles and then intensify into Tropical Storm Fred as it passed south of Puerto Rico. We directed saildrone 1048 (SD-1048) northward to meet the approaching storm, and 2 days later, on 11 August, as Fred passed about 100 kilometers north of SD-1048, the drone recorded a maximum wind gust of 16 meters per second and a significant wave height (the average height of the highest one third of the waves) of 1.7 meters.
Two days later, NHC predicted that another tropical cyclone would form in the western Atlantic and would pass south of Puerto Rico in 2–3 days as Tropical Storm Grace on a track very similar to Fred’s. The center of Grace passed directly over SD-1048 on 15 August. Although the storm had weakened to a tropical depression a few hours earlier, SD-1048 measured a maximum wind gust from Grace of 17 meters per second while SD-1060, situated north of Puerto Rico, observed a significant wave height of 2.5 meters.
The third opportunity came as Henri traveled westward in the central subtropical North Atlantic as a tropical storm starting 16 August (Figure 3). Beginning 15 August, SD-1031 was directed eastward to meet Henri, but near-surface winds were unfavorable, slowing the saildrone’s progress. As a result, SD-1031 ended up on the weaker (western) side of Henri as its path curved northward. Although SD-1031 was only about 40 kilometers west of the storm’s center as it passed on 20 August as a strong tropical storm (with maximum sustained wind speeds of 30 meters per second; Henri later strengthened into a category 1 hurricane), the strongest wind gust measured by SD-1031 was only 20 meters per second, and significant wave heights reached 3.7 meters.
Into the Eye of Sam
A few weeks later, one of our saildrones got a chance to show what it could do inside a full-scale hurricane. On 20 September, an African easterly wave (a type of atmospheric low-pressure system) was forecast to move over the eastern tropical Atlantic and possibly intensify into a strong hurricane as it curved north of the Caribbean islands 7–10 days later. As the track forecast came into better focus, we realized that of the five saildrones, SD-1045 was in the best position to intercept the developing system. We kept SD-1045 on its slow eastward trajectory and watched as the tropical wave became a storm and then rapidly intensified into category 4 Hurricane Sam—the most powerful hurricane of the 2021 season.
On the night of 29 September, 9 days after the initial forecasts and 12 hours before Sam’s predicted arrival, we planned for a complete transect of the hurricane’s eye, with SD-1045 entering through the northeastern eyewall (normally the strongest part of a hurricane) and exiting through the south. However, we had no idea how the saildrone would respond to category 4 hurricane winds and waves, and we expected something on SD-1045 to fail as it traveled through dense clouds, torrential rain, and heavy windblown sea spray. Would it be the sail, one or more of the 12 scientific sensors, or the data transmission system?
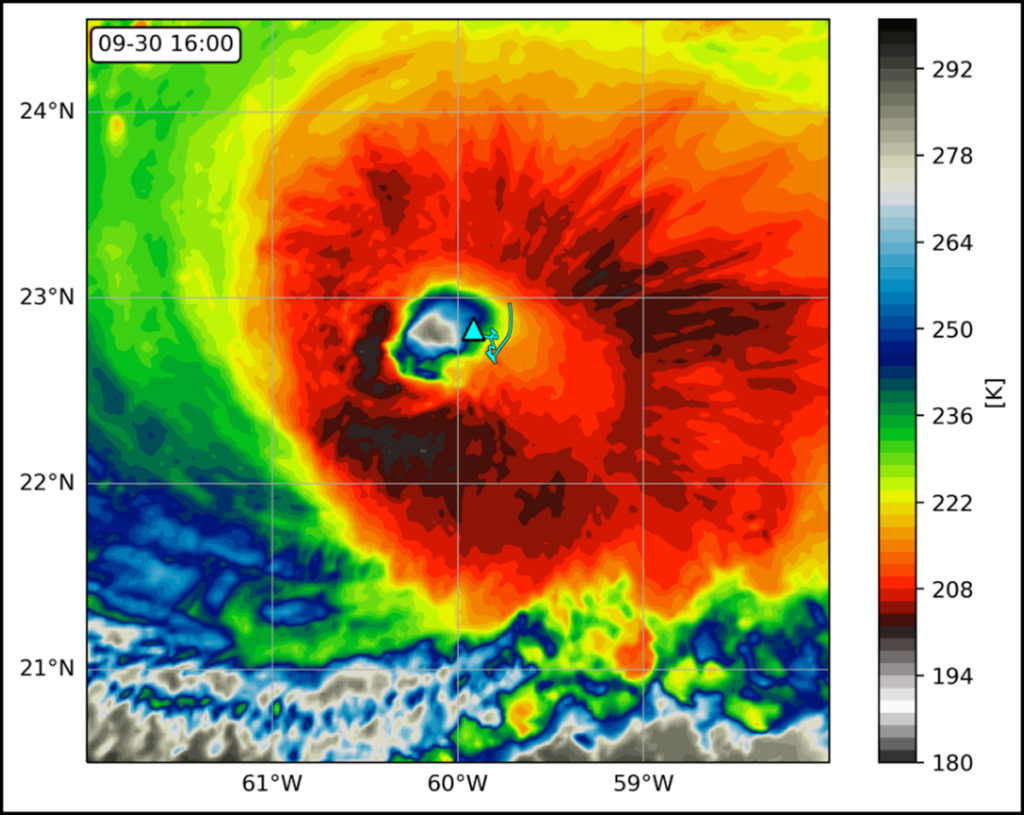
When the first pictures and videos came in from Sam’s northeastern eyewall during the morning of 30 September, it was clear that SD-1045 had hit its mark (Figure 4). No scientist had ever watched the towering waves and violent merging of the ocean and the atmosphere inside a major hurricane from the vantage of the ocean’s surface. Most important, it appeared that all sensors were working perfectly, and the valuable data continued to arrive without interruption as SD-1045 passed inside the eastern eyewall and out through the southern half of the storm.

For 3 hours, SD-1045 weathered sustained hurricane force winds, with maximum gusts of 57 meters per second (128 miles per hour; Figure 5). The significant wave height reached 14 meters, taller than a four-story building, and the highest wave measured 27.6 meters (90 feet). In the days to follow, additional data from SD-1045 further detailed the extreme conditions it faced, including sliding down giant wave faces at speeds of up to 13 meters per second and flipping over completely several times as waves crashed over it.
What We’re Finding and Where We’re Going
Hurricanes generally cool the ocean’s surface, but surprisingly, SD-1045’s data showed that the sea surface did not cool during the first half of the storm. Because of this, the ocean transferred more heat energy to the atmosphere to maintain Sam’s high intensity. The relatively warm sea surface might have resulted from Sam passing over the northern edge of the Amazon-Orinoco river low-salinity plume (lighter gray shading in Figure 3), which is known to inhibit hurricane-induced ocean cooling [Reul et al., 2014].
From satellite data and a NOAA reconnaissance flight into Sam the day before, it appears that SD-1045 may have traveled through an eyewall mesovortex, an area of high-speed rotation with a diameter of a few kilometers, that formed at the edge of the eye. These features often occur in strong hurricanes and can contribute to the formation of tornadoes when a hurricane makes landfall. The saildrone data will be analyzed to determine the possible influence of a mesovortex on near-surface atmospheric conditions such as wind and humidity.

Additional ongoing analyses of SD-1045’s data include comparisons to satellite, aircraft, and other in situ data. We are also assessing hurricane forecast model outputs and evaluating the potential to integrate saildrone data into these models to improve intensity forecasts. We will make direct calculations of the air-sea momentum flux and drag coefficient in Sam using 3D 20-hertz wind measurements and wave data obtained by the saildrone. Such high-frequency wind measurements, which are sensitive to quick wind changes, are needed because of the rapid, turbulent nature of momentum mixing.
For the 2022 Atlantic hurricane season, we plan to expand coordination between saildrones and other elements of the observing system, including ocean gliders and small uncrewed aircraft systems [Cione et al., 2020], as well as dropsondes and ocean probes deployed from hurricane reconnaissance aircraft.
Overall, our goal continues to be the acquisition of high-quality data on ocean-atmosphere conditions and interactions that will help improve hurricane models and intensity forecasts. The successful 2021 hurricane saildrone mission demonstrated a valuable new tool for that purpose and opened the door to a new realm of robotic ocean-observing capabilities.
References
Bell, M. M., M. T. Montgomery, and K. A. Emanuel (2012), Air-sea enthalpy and momentum exchange at major hurricane wind speeds observed during CBLAST, J. Atmos. Sci., 69(11), 3,197–3,222, https://doi.org/10.1175/JAS-D-11-0276.1.
Cangialosi, J. P., et al. (2020), Recent progress in tropical cyclone intensity forecasting at the National Hurricane Center, Weather Forecast., 35(5), 1,913–1,922, https://doi.org/10.1175/WAF-D-20-0059.1.
Cione, J. J., et al. (2020), Eye of the storm: Observing hurricanes with a small unmanned aircraft system, Bull. Am. Meteorol. Soc., 101(2), E186–E205, https://doi.org/10.1175/BAMS-D-19-0169.1.
Domingues, R., et al. (2019), Ocean observations in support of studies and forecasts of tropical and extratropical cyclones, Front. Mar. Sci., 6, 446, https://doi.org/10.3389/fmars.2019.00446.
Gall, R., et al. (2013), The Hurricane Forecast Improvement Project, Bull. Am. Meteorol. Soc., 94(3), 329–343, https://doi.org/10.1175/BAMS-D-12-00071.1.
Holthuijsen, L. H., M. D. Powell, and J. D. Pietrzak (2012), Wind and waves in extreme hurricanes, J. Geophys. Res., 117(C9), C09003, https://doi.org/10.1029/2012JC007983.
Le Hénaff, M., et al. (2021), The role of the Gulf of Mexico ocean conditions in the intensification of Hurricane Michael (2018), J. Geophys. Res. Oceans, 126(5), e2020JC016969, https://doi.org/10.1029/2020JC016969.
Meinig, C., et al. (2019), Public-private partnerships to advance regional ocean-observing capabilities: A Saildrone and NOAA-PMEL case study and future considerations to expand to global scale observing, Front. Mar. Sci., 6, 448, https://doi.org/10.3389/fmars.2019.00448.
Miles, T. N., et al. (2021), Uncrewed ocean gliders and saildrones support hurricane forecasting and research, Oceanography, 34(4), 78–81, https://doi.org/10.5670/oceanog.2021.supplement.02-28.
Mitarai, S., and J. C. McWilliams (2016), Wave glider observations of surface winds and currents in the core of Typhoon Danas, Geophys. Res. Lett., 43(21), 11,312–11,319, https://doi.org/10.1002/2016GL071115.
Reul, N., et al. (2014), Multisensor observations of the Amazon-Orinoco river plume interactions with hurricanes, J. Geophys. Res. Oceans, 119(12), 8,271–8,295, https://doi.org/10.1002/2014JC010107.
Rogers, R. F. (2021), Recent advances in our understanding of tropical cyclone intensity change processes from airborne observations, Atmosphere, 12(5), 650, https://doi.org/10.3390/atmos12050650.
Author Information
Gregory R. Foltz ([email protected]), Atlantic Oceanographic and Meteorological Laboratory, NOAA, Miami, Fla.; Chidong Zhang and Christian Meinig, Pacific Marine Environmental Laboratory, NOAA, Seattle, Wash.; Jun A. Zhang, Atlantic Oceanographic and Meteorological Laboratory, NOAA, Miami, Fla.; also at Cooperative Institute for Marine and Atmospheric Studies, University of Miami, Fla.; and Dongxiao Zhang, Pacific Marine Environmental Laboratory, NOAA, Seattle, Wash.; also at Cooperative Institute for Climate, Ocean, and Ecosystem Studies, University of Washington, Seattle