
In mid-February 2021, heavy storms brought intense downpours to the eastern Mediterranean coast, keeping residents indoors. After the storms passed, residents returned to local beaches and noticed signs that something amiss had occurred offshore. In Israel, clumps of tarred sand appeared on beaches, along with oil-covered wildlife like turtles and fish. A dead 17-meter-long fin whale also washed ashore—an autopsy revealed oily liquid in its lungs, although the source of the oil was not identified definitively.
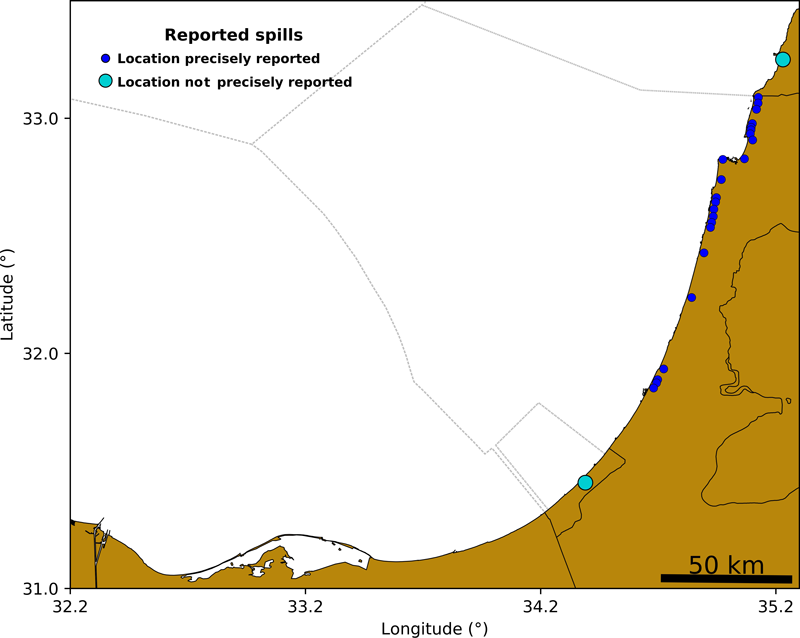
Experts estimated that more than a thousand metric tons of tar had landed along 180 kilometers of the Israeli and Lebanese shorelines in mid-February (Figure 1). Gaza also reported that similar arrivals of tar had reached its beaches. The findings forced Israeli authorities to announce the temporary closure of the country’s beaches on Sunday, 21 February, and prompted calls to identify the source (or sources) of the oil, which was not immediately clear.
It might have come from deliberate dumping from one or more ships, possibly the result of malicious acts or operational discharges (e.g., releases of oily water after flushing cargo tanks or emptying ballasts). Pavlakis et al. [1996] reported that such spills occur with considerably higher frequency than those caused by ship accidents. In a 1998 report, the European Space Agency (ESA) estimated that 45% of marine oil pollution comes from operational discharges from ships. The same ESA report estimated that more than 4.5 million metric tons of oil are poured into the sea worldwide annually. It is thus clear that oil spills in the ocean are not isolated events. Rather, they are a constant threat that silently poisons water, air, and flora and fauna at sea and on coasts and, as a direct result, poses risks to humanity.
As authorities began addressing the 2021 spill, they found immediate differences between their investigation and other oil spill investigations. Normally, the origin of a spill is known, and the investigation is focused on monitoring the evolution of the slick, with associated attempts to prevent the oil from contaminating the natural landscape. In this case, the affected areas and wildlife were evident, but the locations and number of spills involved were unknown.
Oceanic turbulence, which leads to constantly changing conditions as it produces swirling eddies and redirects currents, created further difficulties for investigators trying to identify the oil spill’s origins. To address these challenges, we have developed a model that makes use of remote sensing data and our understanding of the dynamics of nonlinear systems to identify the source or sources of oil spills—and to keep turbulence from serving as a cover for environmental pollution.
Remote Sensing Detects Oil Slicks
The first step in identifying the source of a marine oil spill is to locate the associated oil slick. One way to do this is to examine synthetic aperture radar (SAR) images gathered by satellites (e.g., Sentinel-1) or aircraft. SAR works by transmitting successive microwave pulses to “illuminate” a target scene, and then receiving and recording the scattered echoes of the pulses. The method can thus be used to detect atmospheric or oceanic phenomena that imprint their signal on the ocean surface.
For example, wind can generate roughness in the form of small “wrinkles,” or capillary waves, on the water’s surface, whereas effects of gravity can create undulations called gravity waves with wavelengths stretching from a few to several tens of centimeters (similar to the radar wavelength). The radar sensor records the SAR pulses scattered by a rough ocean surface, producing an image of the surface roughness.
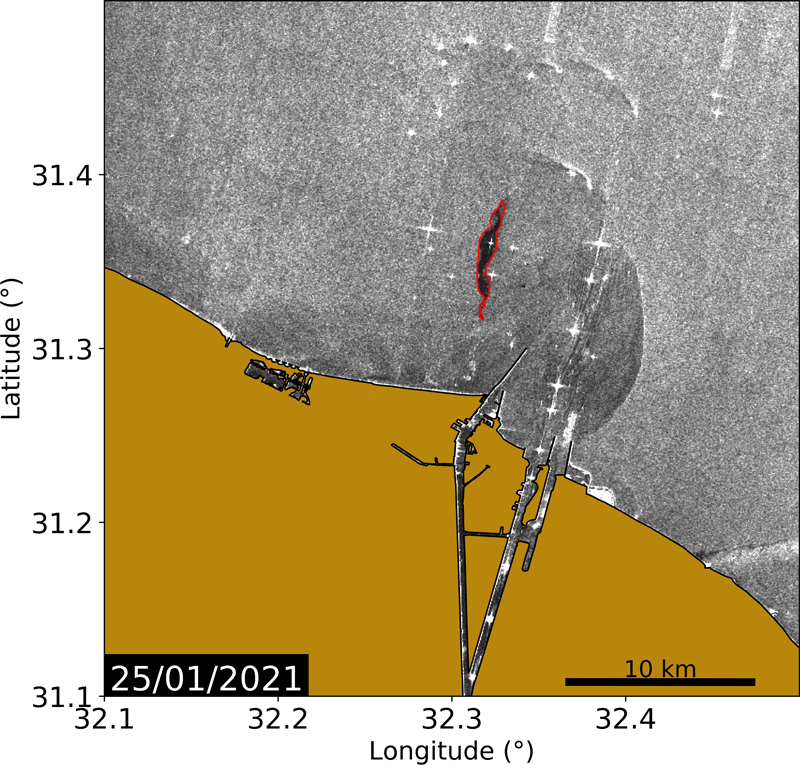
By contrast, floating oil spills smooth the sea surface, damping capillary waves and preventing radar backscattering. As a result, oil spills can be identified from the dark patterns they produce in SAR imagery (Figure 2). Other phenomena, however, such as fishing activities or biogenic slicks produced by phytoplankton, can produce patterns similar to oil slicks in SAR images. Thus, knowledge of the study area and supplementary information—from wind field data, remotely sensed ocean color data, and radiometric imagery (e.g., from Sentinel-2)—are helpful for discriminating among different phenomena.
To track the source (or sources) of the 2021 tar deposits, we used SAR data from Sentinel-1A and -1B to first identify oil slicks in the Mediterranean at the time. We used sea surface wind field data from the European Union’s Copernicus Marine Service Information, wind advanced scatterometer (ASCAT) data from the Metop A and B satellites, and operational model variables from the European Centre for Medium-Range Weather Forecasts, as well as ocean color data from the Ocean and Land Colour Instrument (OLCI) sensors aboard Sentinel-3A and -3B to support our interpretation of the SAR imagery.
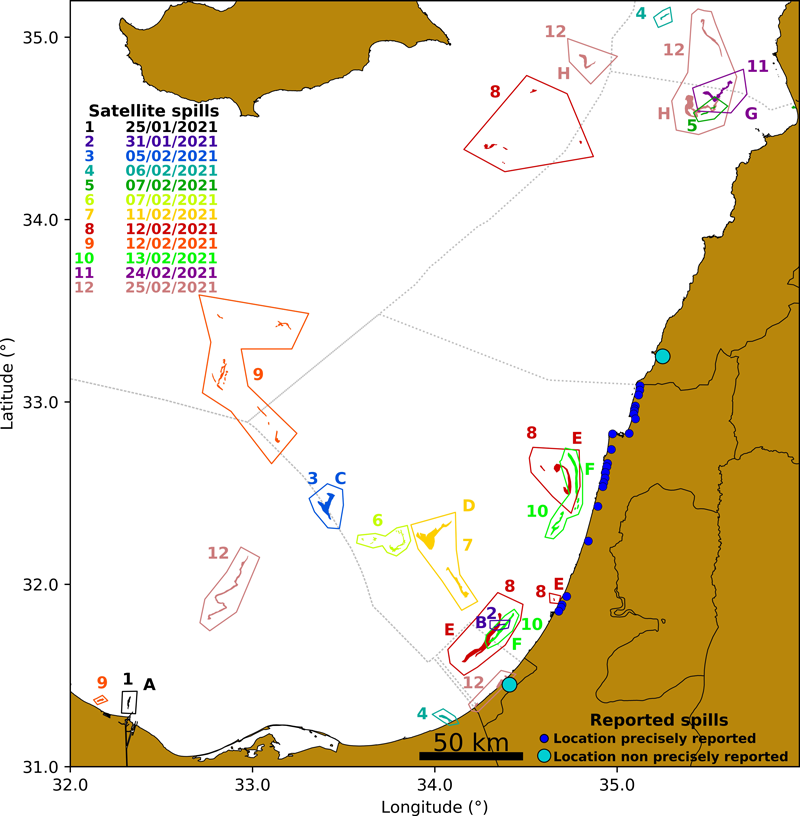
Applying these techniques, we detected several dark features thought to be related to oil slicks near the coasts of Gaza, Israel, and Lebanon (Figure 3). In principle, oil and tar from any of them could have reached the shoreline. To prove it, though, we needed to simulate the evolution of these slicks over time.
Chaos at Sea
The biggest challenge in studying oceanic transport of oil slicks or other pollutants like marine litter is that the ocean is turbulent. Turbulence in the ocean comes from various sources: Winds create ripples that travel laterally over the surface as well as vertically through the water column. Daytime heating and nighttime cooling cause seawater to migrate along temperature gradients. Currents moving in different directions spin off eddies, and in shallow waters, currents become turbulent as they drag along the bottom.
In addition to turbulence, researchers must also consider complications introduced by chaos in the ocean. Chaos refers to the observation that in dynamical systems, small differences in the initial conditions of the system can yield widely diverging outcomes, rendering long-term prediction of such systems’ behavior extremely difficult. Chaos does not represent randomness; rather, it appears in deterministic systems—that is, systems whose behavior follows a unique evolutionary path that is fully determined by initial conditions, with no random elements involved. In deterministic systems, this evolution can be traced backward in time, potentially revealing that portions of material (e.g., different clumps of oil or tar) that are physically close together at a given time might have originated from different starting points. Thus, oil from multiple different spills could end up on the same beach.
State-of-the-art simulations of oil spill evolution involve modeling slicks as a collection of particles with different properties, such as mass, density, and composition, among others—the more particles, the better the representation. In a case like that of the 2021 eastern Mediterranean oil spills, the typical approach would be to place the particles initially along the affected coastal areas and then run the simulation backward. However, because the ocean is turbulent and chaotic—and we don’t know the exact sequence of events—the result would be a cloud of particles spread over a broad area. But we know that the oil that polluted the coast in 2021 must have had more localized origins, so how can we determine which of the slicks seen in the SAR images were responsible? We need a new tool that allows us to navigate through turbulence and seeming disorder.
Revealing Order in a Disordered Ocean
Geometrical structures and shapes—for example, in Jupiter’s atmosphere or Earth’s oceans—display subtle and sophisticated order over many scales.
Observational technologies based on satellite imagery and remote sensing techniques have uncovered deep connections between the structure of transport in fluids such as oceans and atmospheres and the mathematical theory of nonlinear dynamical systems. Indeed, imagery often reveals geometrical structures and shapes—for example, in Jupiter’s atmosphere or Earth’s oceans (Figure 4)—displaying subtle and sophisticated order over many scales.
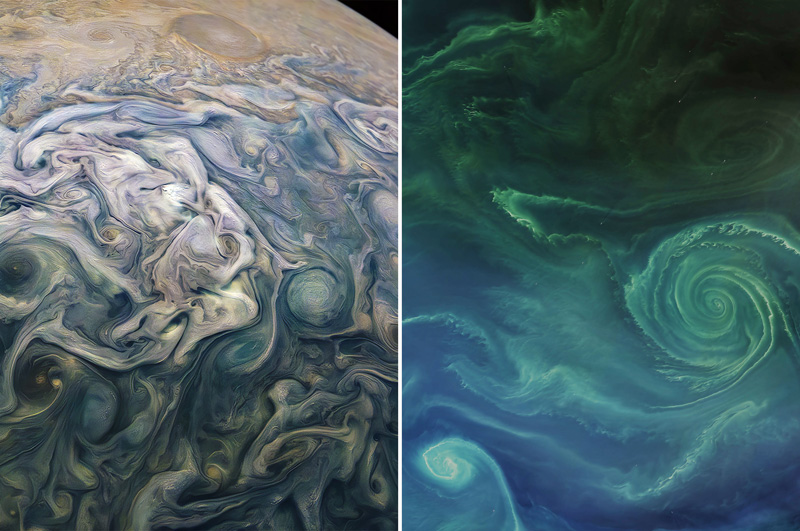
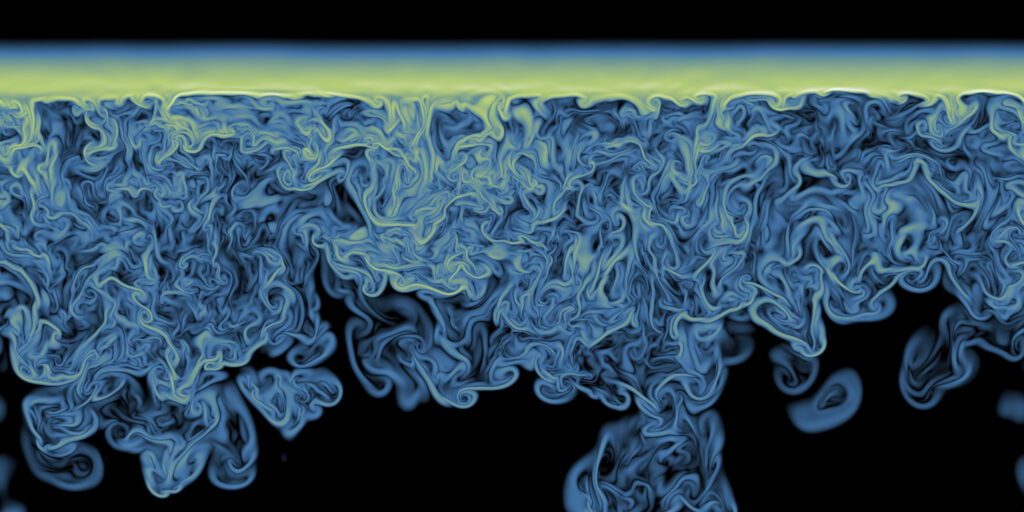
Transported material in these flows—whether ammonia in Jupiter’s atmosphere or green phytoplankton in the Baltic Sea—aligns along boundaries called invariant manifolds or Lagrangian coherent structures (LCSs). In nonlinear dynamical systems like the ocean, LCSs can be treated mathematically to help identify how and why fluid flows are organized into ordered patterns. LCSs can be considered to represent the “skeleton” of turbulence, and although they are typically hidden from plain sight, they can be visualized using visible tracers (e.g., Figure 5). LCSs thus allow us to classify the fluid in regions with similar dynamics. This ability is vital for modeling the evolution of oil slicks because it gives us guidelines to recognize, at a glance, domains in the ocean surface with intricate shapes in which fluid parcels have similar origins or fates, thus providing an intuitive vision of oil spill evolution and how it mixes up on the ocean surface.
The representation of LCSs in simulations can be achieved using ocean current data sets and Lagrangian descriptors (LDs), a mathematical tool that highlights time-dependent invariant manifolds in flows. In our work, this approach revealed patterns and paths along which oil spills in the eastern Mediterranean became aligned in February 2021. These patterns, in turn, enabled identification of the source locations of the spills that severely affected coastal areas [García-Sánchez et al., 2022].
The simulation indicates the likely sources of the oil and tar that reached the eastern Mediterranean coastline as the spills first seen on 25 and 31 January.
The video below shows the evolution of the LDs—and of flow paths and spills—in the eastern Mediterranean from 25 January to 25 February 2021. The simulation model flows in a layer that extends from the sea surface to a depth of 0.5 meter. The darker the region of the sea, the quieter the ocean is; that is, the particles in those regions travel less than particles in the brighter regions. The brighter coloration highlights the swirling LCSs, which act as dynamic barriers that the oil particles cannot cross. Oil slicks identified from SAR imagery during this time are denoted initially in red, and the evolution in shape and location of several over time are represented by blobs of color: orange for a slick that originated near the coast of Egypt on 25 January; blue for one originating off southern Israel on 31 January; and green for one that began farther offshore on 5 February. As the video progresses, we see the slicks align with the LCSs, and portions of two slicks eventually reach the coastline (pink) beginning on 16 February. Thus, the simulation indicates the likely sources of the oil and tar that reached the eastern Mediterranean coastline as the spills first seen on 25 and 31 January.
The approach described here—combining capabilities for remote sensing and modeling turbulent, nonlinear systems—is thus capable of finding order in the apparent chaos of the ocean. With continuing improvements, we foresee our method’s potential operational application not only for pinpointing the sources and dates of specific oil spills, but also for monitoring whether specific areas of the ocean are being used as “dumping grounds.” It can also help identify areas where oil spills present the greatest hazard to coastal communities and ecosystems.
Acknowledgments
We accessed SAR data from Sentinel-1A and -1B from the Copernicus Open Access Hub and processed these data using the SNAP-ESA Sentinel Application Platform. Wind data were gathered from the Copernicus Marine Service (product code 012_004V6); the wind data product corresponds to global near-real-time wind data every 6 hours with a spatial resolution of 0.25°. Ocean color data were gathered from the Copernicus Open Access Hub and were processed using SeaDAS.
References
García-Sánchez, G., et al. (2022), Structured pathways in the turbulence organizing recent oil spill events in the eastern Mediterranean, Sci. Rep., 12, 3662, https://doi.org/10.1038/s41598-022-07350-w.
Pavlakis, P., A. J. Sieber, and S. Alexandry (1996), Monitoring oil-spill pollution in the Mediterranean with ERS SAR, Earth Obs. Q., 52, 8–11.
Author Information
Guillermo García-Sánchez ([email protected]) and Ana M. Mancho, Consejo Superior de Investigaciones Científicas, Madrid, Spain; Antonio G. Ramos and Josep Coca, Universidad de Las Palmas de Gran Canaria, Las Palmas, Canary Islands; and Stephen Wiggins, University of Bristol, Bristol, U.K.