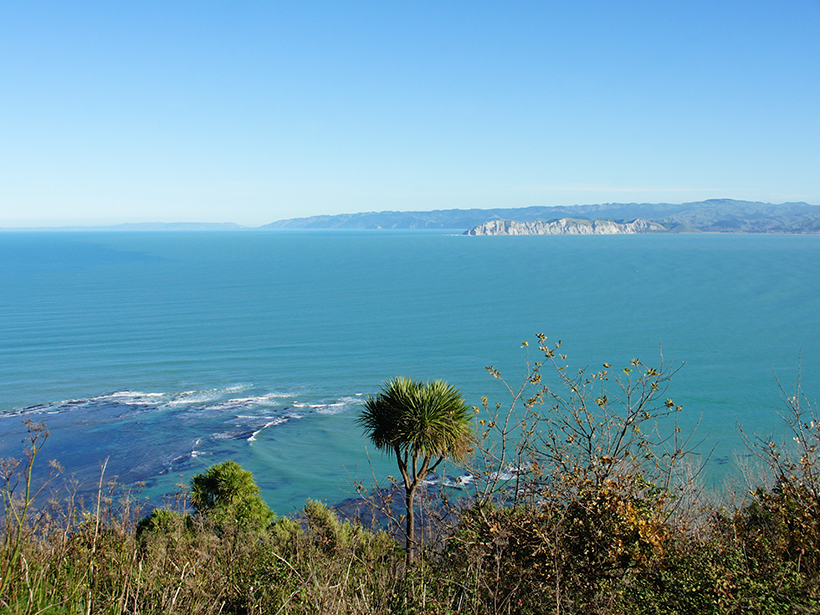
Source: Geophysical Research Letters
New Zealand’s North and South islands are well known for providing picturesque scenery. Beneath its bucolic veneer, however, the country is continuously being ripped to shreds by geophysical activity. Each year, New Zealand experiences around 14,000 tremors, as it falls directly on the interface between two massive slabs of Earth’s crust: the Pacific and Australian tectonic plates.
Along the east coast of New Zealand’s North Island, a large underwater plateau on the Pacific plate is being forced (or subducted) beneath the island, which sits atop the Australian plate. This activity is gradually grinding away at the thick mountain of crust, leading to frequent earthquakes and other seismic activity. However, the physical properties of subduction interfaces like this one and how they help control coupling (a lack of slippage caused by friction) between two plates are not well understood.
Because this interface lies at such shallow depths (about 16–32 kilometers below the coastline), scientists are able to use land-based geophysical techniques to study it. In a recent study, Heise et al. synthesize the results of magnetotelluric and geodetic studies and use earthquake data to investigate this seismically active area, known as the Hikurangi subduction margin.
The movement of Earth’s crust is tracked by geodetic data—a set of coordinates that refers back to a known point, such as sea level. The geodetic data, collected on the Hikurangi margin, show that the coupling between the two plates is weak in the northern part of the margin and firmly locked together in the south. In addition, in the northern part of the Hikurangi margin, large areas of slow slippage (roughly the size of a magnitude 6 or 7 earthquake) occur offshore about once every 2 years.
To image the plate boundary at depth, the team applied a method called magnetotellurics, which uses natural variations in Earth’s magnetic and electric fields over time to measure the electrical conductivity (and its opposite, electrical resistivity) of rocks and minerals below Earth’s surface, shedding light on the underlying geological structure and processes. Using magnetotellurics data from 132 measurement sites in the northern Hikurangi margin, the researchers created an image showing electrical resistivity at different depths across the region.
To test the idea that coupling is directly related to a subduction zone’s electrical resistivity, the researchers compared the magnetotellurics data to the geodetic data, as well as to earthquake data from the region. They found that an especially electrically resistive section of the Hikurangi margin has more coupling than in the rest of the margin.
The finding suggests that coupling behavior is controlled by the amount of fluid and sediment along the plate boundary. Clusters of small earthquakes occurring on the plate interface in this section with greater electrical resistivity suggest also a higher density of small asperities—points along the edge of a plate that are stuck in place—which increases the likelihood of subduction earthquakes forming in the area.
This study, particularly the first-of-its-kind magnetotellurics image, is a crucial step toward understanding how fluids, sediment, and other material properties along subduction zones affect the underlying mechanics of earthquake behavior. This is particularly important in a region that is highly prone to seismic activity, from undetectable tremors to massive megathrust earthquakes. (Geophysical Research Letters, https://doi.org/10.1002/2017GL074641, 2017)
—Sarah Witman, Freelance Writer
Citation:
Witman, S. (2017), Imaging the underlying mechanics of New Zealand earthquakes, Eos, 98, https://doi.org/10.1029/2017EO083807. Published on 18 October 2017.
Text © 2017. The authors. CC BY-NC-ND 3.0
Except where otherwise noted, images are subject to copyright. Any reuse without express permission from the copyright owner is prohibited.

