Source: Water Resources Research
The fine-scale structure of an aquifer is difficult to determine, posing challenges for scientists trying to predict underground water flow and transport. In a new paper, Gueting et al. demonstrate the potential for recent advances in ground-penetrating radar (GPR) to image aquifer structure in unprecedented detail.
The researchers used a new approach to a method known as cross-borehole GPR. In this technique, a transmitter placed in a borehole emits an electromagnetic wave that travels to a receiver in another borehole several meters away. Underground features disrupt the wave as it travels, so the altered wave picked up by the receiver contains information about the structure of these features. Analysis of the wave data can then reveal these structures.
Traditional GPR data analysis uses a mathematical method that strongly simplifies the presumed path of the wave through the ground, limiting the clarity of perceived underground features. In the newer approach used by the team, a technique called full-waveform inversion more accurately reconstructs the wave’s path, allowing for improved resolution.
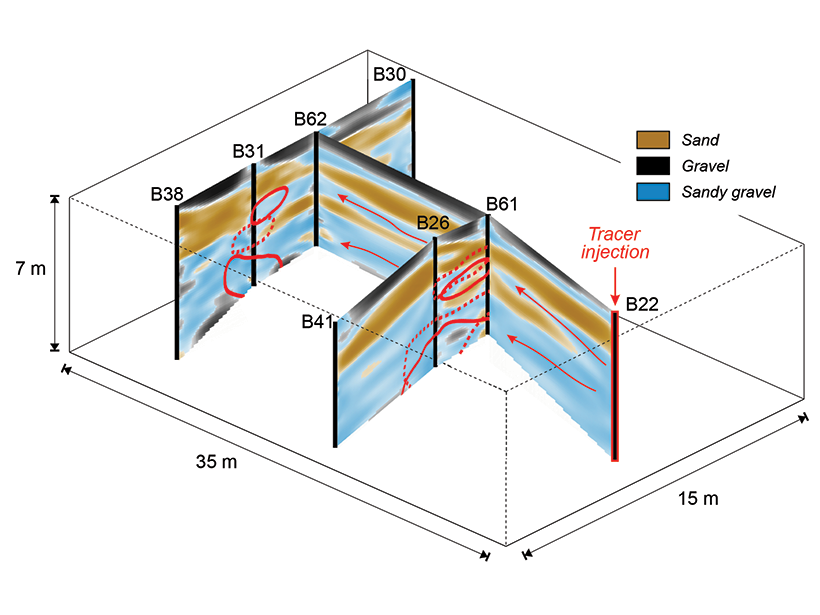
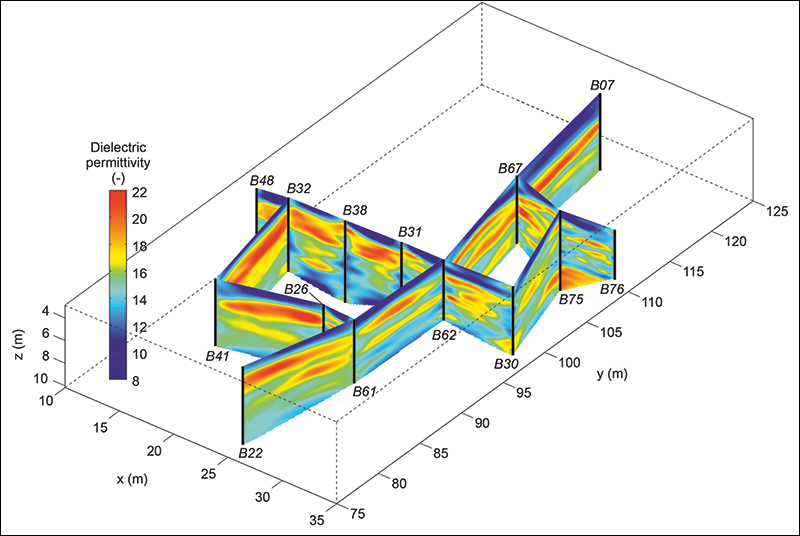
The researchers used full-waveform inversion of cross-borehole GPR data to investigate underground water dynamics at an alluvial aquifer near Cologne, Germany. Using several densely spaced boreholes, they took measurements along cross sections that were 50 meters long and 10 meters deep. Repeated measurements with the transmitter and receiver placed in slightly different positions allowed them to construct images of the aquifer structure with a resolution at the scale of decimeters.
In one hydrogeological experiment, a tracer injected into a borehole flowed downstream, where its concentration was detected at various points. Full-waveform inversion analysis suggested the presence of a thin layer of sand that would explain the observed tracer concentrations. This sand layer was not detected using traditional GPR data analysis, demonstrating the strength of full-waveform inversion.
Currently, this study is one of just a few that have investigated GPR full-waveform inversion. The scientists hope that their results will encourage a growing number of researchers to use the new technique. (Water Resources Research, doi:10.1002/2016WR019498, 2017)
—Sarah Stanley, Freelance Writer
Citation:
Stanley, S. (2017), New ground-penetrating radar method shows promise in aquifer, Eos, 98, https://doi.org/10.1029/2017EO066601. Published on 06 February 2017.
Text © 2017. The authors. CC BY-NC-ND 3.0
Except where otherwise noted, images are subject to copyright. Any reuse without express permission from the copyright owner is prohibited.