
Consider a seasonally dry landscape in a hilly or mountainous region where little or no rain or snow falls for months at a time. How is it that months into the dry period, forests can remain green and productive and streams can keep flowing? The answer must be that earlier precipitation remains available, as subsurface moisture to trees and as groundwater that slowly drains to rivers. This subsurface water supply maintains not only trees and streams but also entire water-dependent terrestrial and river ecosystems. These streams also become the rivers that serve as the main water supplies for downstream hydropower and for agricultural and urban users.
All of this water storage occurs in the critical zone, the near-surface layer of Earth where coevolving geomorphic, hydrologic, geochemical, and ecological processes create dynamic, deep water-storing systems out of solid, nearly impermeable bedrock. But under what conditions, and by what mechanisms, is subsurface moisture maintained or, in multiyear drought conditions, say, insufficient? Understanding controls on critical zone properties and processes like water storage, as well as how the critical zone will respond to land use and climate change, and how this knowledge can enhance ecosystem resilience and prediction of drought effects will be, well, critical for many years to come.
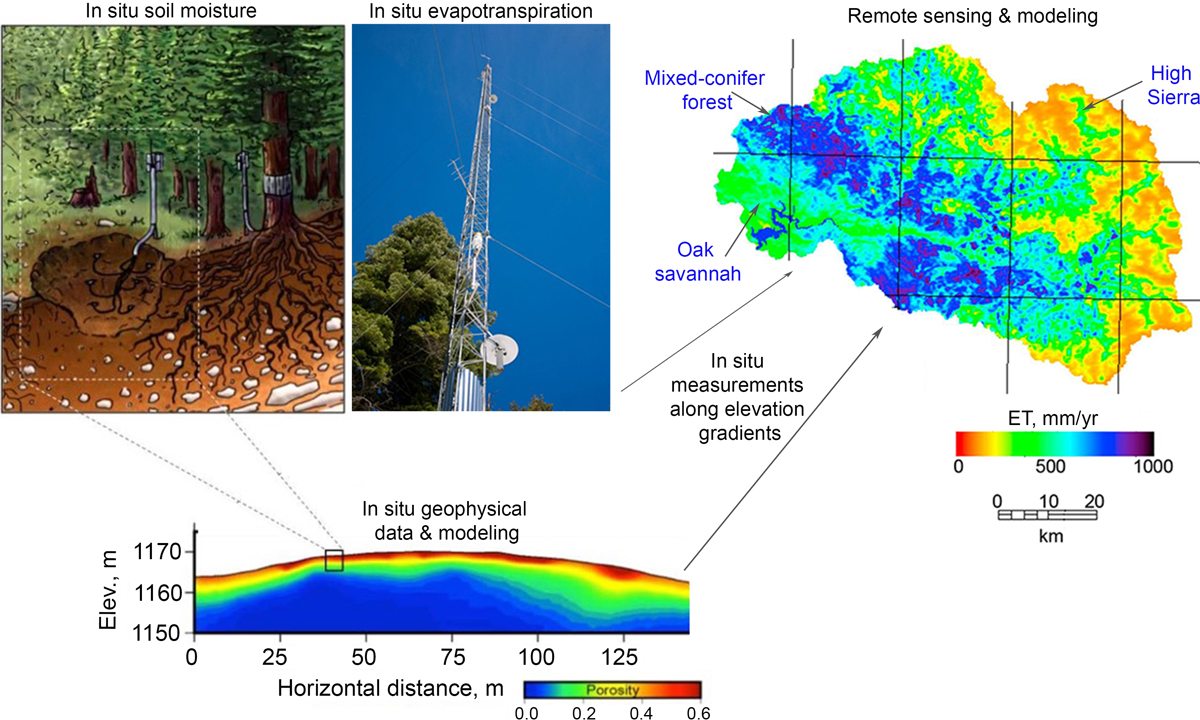
In California, with its wet, cool winters and dry, hot summers, programs at two Critical Zone Observatories (CZOs) have intensively monitored and quantified water use by the forest (evapotranspiration, or ET) and potential sources of moisture in the subsurface for more than a decade. At the Southern Sierra CZO, along a transect from the oak savannahs near the San Joaquin Valley city of Fresno to the conifer forests of the high Sierra Nevada, researchers have investigated effects of elevation and a climate gradient on moisture. At the Eel River CZO, west of Laytonville, amid the conifer–hardwood forests and savannah of the Northern Coast Ranges, they have looked at effects of sharply contrasting bedrock properties in a common climate.
Severe Drought Strikes
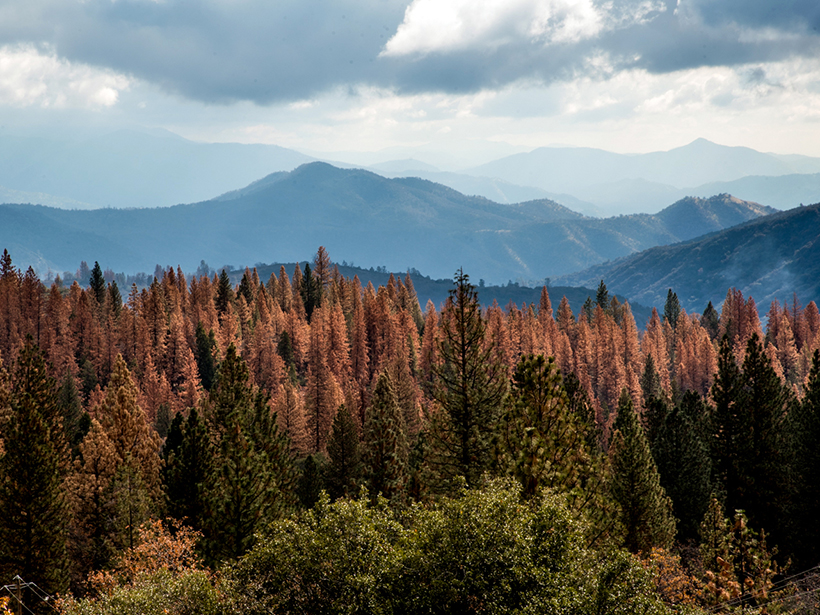
Several years into the research at the California CZOs, a multiyear drought lasting from fall 2011 to fall 2015 hit the state, causing massive tree death in the southern Sierra, while in Northern California there was essentially none. The massive die-off in the Sierra was a wake-up call for land managers and researchers alike (Figure 1), whereas the absence of tree death in Northern California during the drought raised its own challenging scientific questions.
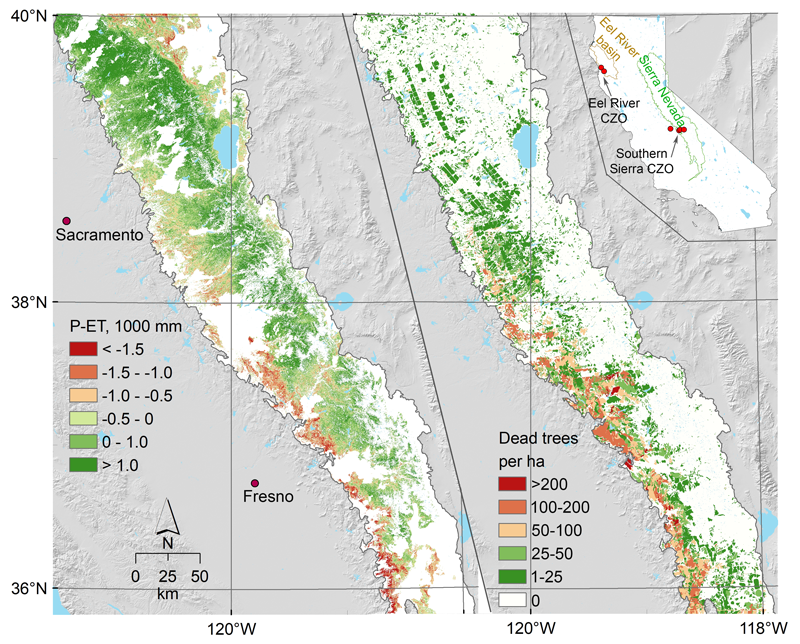
In both cases, the availability of stored moisture in the subsurface was a crucial factor. It has been long known that in the Sierra, deeply weathered granite stores winter moisture on which the forests rely in summer [Graham et al., 2010]. Scientists at the Southern Sierra CZO sought to extrapolate quantitative moisture and water balance measurements collected at individual plots to the regional scale and, from those extrapolations, to predict tree die-off responses (Figure 1).
At the Eel River CZO, researchers intensified their collection of local measurements to document the depth and spatial variation in moisture storage and the use of this moisture by different types of trees. Two different plant ecosystems thrive within the observatory field sites, though they share a similar climate in the same rainfall regime: one a dense evergreen, mixed conifer–hardwood forest (mostly Douglas fir, oak, and madrone) developed in a critical zone that extends to 30 meters deep at hilltops in shale bedrock; and the other a grass and deciduous oak savannah developed in a thin (less than 4 meters deep) critical zone in intensely sheared shale bedrock. Scientists at the CZO wanted to explain not only why two different plant ecosystems both survived the drought [Hahm et al., 2019a], but also how differences in the underlying bedrock resulted in the development of distinct ecosystems in the first place.
Measuring Moisture in the Critical Zone
To document moisture storage changes, scientists at the Southern Sierra CZO correlated local measurements of ET from eddy flux towers with remotely sensed detections of live green vegetation abundance (derived from satellite measurements of the normalized difference vegetation index) to estimate ET over large areas. Measurements of precipitation, runoff, and changes in water storage in soil and weathered bedrock were used to quantify subsurface water storage dynamics (Figures 1 and 2). During the multiyear drought, moisture depletion occurred to depths of 4.5–10 meters [O’Geen et al., 2018]. Further, areas estimated to have a large negative cumulative difference between annual precipitation and evapotranspiration between fall 2011 and fall 2015 were found to correlate with areas of significant tree death (Figure 1).
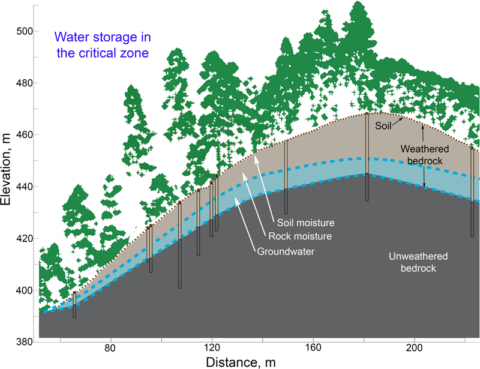
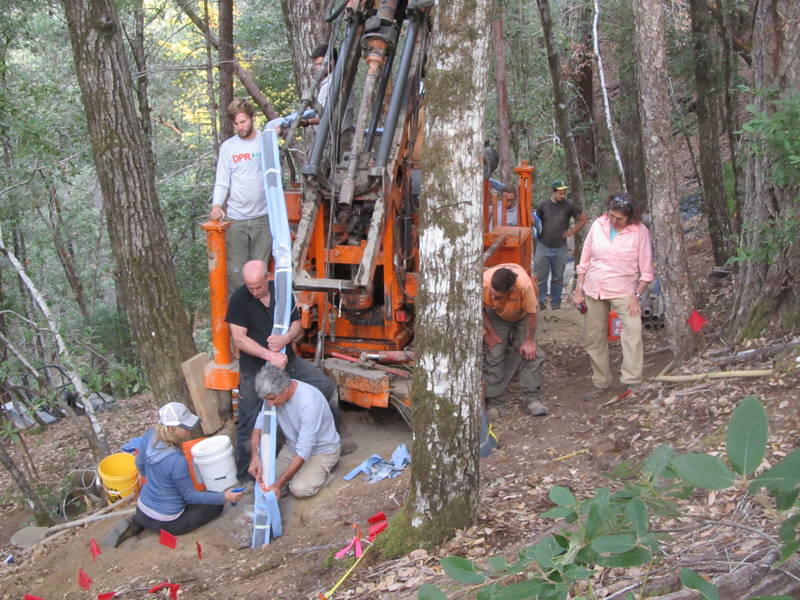
At the Eel River CZO, researchers made detailed and direct measurements of moisture change in soil and weathered bedrock (Figure 3) at sites developed on the two bedrock types. Using soil moisture monitors and probes lowered down wells, Rempe and Dietrich [2018] also documented an annual cycle of summer depletion of soil moisture and rock moisture (plant-available moisture stored in the weathered bedrock) due to forest transpiration, followed by winter recharge of moisture from rainfall to a characteristic maximum value. Across a well-instrumented hillslope, the average seasonal moisture change was about 60 millimeters (of equivalent rainfall) in the soil and 280 millimeters in the weathered bedrock. Importantly, even in the driest year (2014), when just 1,027 millimeters of rain fell (about half of average), the rainfall was still sufficient to fully recharge the subsurface moisture content to its typical maximum value. Nearly 30% of the drought-year precipitation was stored in the subsurface to depths of up to 8 meters. At the study site where the critical zone is thin (roughly 3 meters), the annual rainfall even in a severe drought significantly exceeded the moisture storage capacity.
In contrast to the Eel River sites, there is greater subsurface storage in the Sierra Nevada. However, this large storage, combined with more than a century of fire suppression by land managers, has resulted in overshoot of vegetation and ET relative to what the highly variable precipitation will sustain. In this region, annual ET is about equal to the average precipitation [Goulden and Bales, 2019], but from fall 2011 to fall 2015, a cumulative multiyear drawdown of 1,400 millimeters of water depleted root-accessible moisture, resulting in near-complete conifer mortality at 1,100-meter elevation [Klos et al., 2018].
Drought Resistance Versus Vulnerability
Vegetation in areas with shallower critical zones may, surprisingly, be less susceptible to drought, because even in dry years, the maximum moisture storage, though limited, is restored in full.
From the work at the two CZOs, it is evident that susceptibility to drought occurs when precipitation fails to fully recharge the moisture storage capacity of the subsurface, leading to unsustainable drawdowns of plant-available moisture during significant periods of drought [Bales et al., 2018]. Hahm et al. [2019b] proposed labeling this a precipitation-limited condition controlling moisture availability. In contrast, if annual precipitation never fails to replenish storage capacity, then moisture availability will be insensitive to droughts. This can be called a storage capacity–limited condition. This suggests that vegetation in areas with shallower critical zones may, surprisingly, be less susceptible to drought, because even in dry years, the maximum moisture storage, though limited, is restored in full. Both Eel River CZO sites are storage capacity–limited sites despite large differences in critical zone thickness.
Hahm et al. [2019b] used water balance analyses to estimate water storage capacity at 25 gauged watersheds in California. (Summer-available water stored during winter was equal to winter precipitation minus winter evapotranspiration and winter runoff.) They showed that in basins where winter storage is independent of winter rainfall, there is little sensitivity of summer plant productivity (as indicated by remotely sensed measurements of enhanced vegetation index) to winter precipitation. But in basins where water storage is higher when there is more precipitation, plant productivity is also increased. These two cases exemplify the storage capacity–limited and precipitation-limited conditions.
In contrast, using flux tower data ET from 25 sites in the western United States (including at several CZOs), Rungee et al. [2019] found that more than half of the annual ET at most of the sites with a Mediterranean-type climate was supported by dry-season drawdown of subsurface moisture, with several exhibiting only partial replenishment during multiyear dry periods. At monsoon‐dominated sites, less than one third of the annual ET came from dry-season drawdown, with little evidence of incomplete replenishment during drought.
Applications in Resource Management
Predicting drought resistance is an immediate concern where the warming climate and past forest management, including fire suppression, have contributed to overstocked forests with moisture demands that exceed moisture availability. As Figure 1 shows, the cumulative sum of precipitation minus evapotranspiration can be used to identify areas where drought leads to tree death [Goulden and Bales, 2019]. Compared with other indices used to define drought risk, such as the Palmer Drought Severity Index, this simple index proved more accurate for the forested Sierra. Using water balance analyses in gauged watersheds to document the dependence of water storage capacity on winter rainfall is another means to identity vulnerable, precipitation-limited areas.
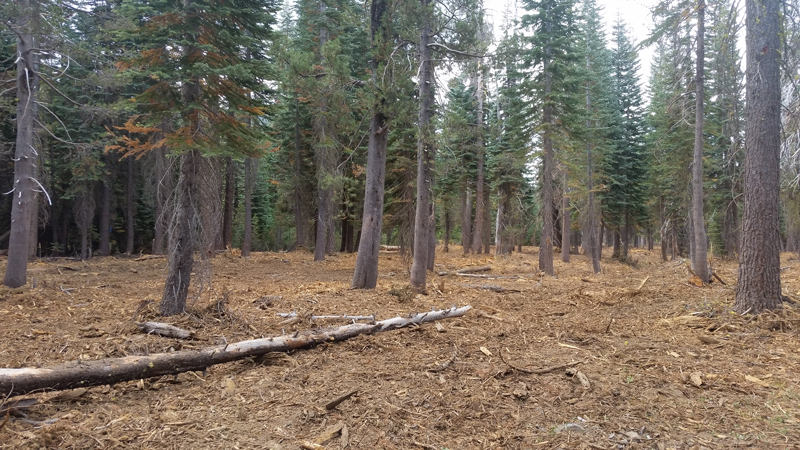
In the Sierra Nevada, dense forests are vulnerable to both high-intensity wildfire and drought-induced tree mortality. Mapping areas with these vulnerabilities can guide the locations and extent of restoration treatments. Forest thinning now in progress in the Sierra Nevada is projected to cost billions of dollars to complete, with the treatment costing at least $2,000 per hectare, or more where expenses cannot be partially offset by the sale of merchantable timber or biomass. To improve both wildfire and drought resistance, biomass removals on the order of 50% are being carried out in some areas, restoring forests to stem and biomass densities observed 100–150 years ago (Figure 4). Both seasonal and over-year water storage are key attributes for planning forest management [Roche et al., 2020].
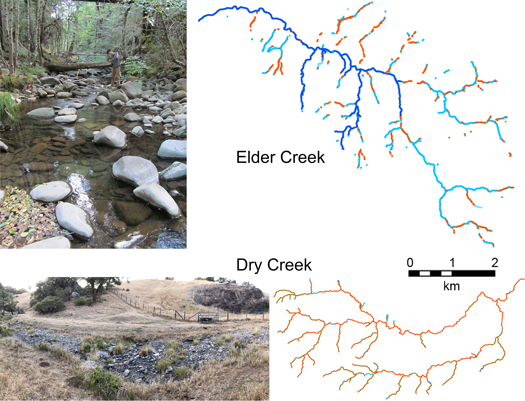
In Northern California, salmon populations are threatened by water diversions and the warming climate. Observations from the Eel River CZO suggest that areas with deep critical zones store groundwater that slowly drains to channels and supports summer base flows, whereas in areas with shallow critical zones, the limited groundwater leads to dry channels in the summer (Figure 5). Local geology and its influences on critical zone properties can be used to identify potential refugia streams with sustained summer base flows that need protection.
Sustaining and Scaling Up
Researchers working at the CZOs in California have learned a lot in the past 13 years. We have developed and verified methods to measure subsurface root-accessible water storage and started applying methods to scale up these measurements across the landscape. And through both empirical observations and hydrologic modeling, we have shown the importance of deep subsurface water storage in controlling how hydrology affects overlying ecosystems.
Yet there is more to do. Predicting critical zone properties, including root-accessible water storage, remains an important challenge in critical zone science [e.g., Dralle et al., 2020]. Links between long-term processes (e.g., weathering and formation of subsurface water storage capacity) and short-term processes (e.g., ecosystem responses to perturbations in water and nutrient cycles) are important for understanding of the water and nutrient processes in the critical zone [Ackerer et al., 2020; Lebedeva and Brantley, 2020]. Both process-based modeling [e.g., Riebe et al., 2017] and empirical scaling approaches [e.g., Hahm et al., 2019b; Goulden and Bales, 2019] will help address these research needs and should be further developed.
Central to these advances will be sustained measurements across climate and geologic gradients over multiyear periods. With these data, lessons learned from critical zone science can continue to be scaled up from local sites to answer important questions on continental and global scales. This work offers vital contributions to inform forest management, drought preparation and response, ecosystem restoration, water infrastructure investments, carbon storage, and much more.
References
Ackerer, J., et al. (2020), Determining how critical zone structure constrains hydrogeochemical behavior of watersheds: Learning from an elevation gradient in California’s Sierra Nevada, Frontiers Water, 2, 23, https://doi.org/10.3389/frwa.2020.00023.
Bales, R. C., et al. (2018), Mechanisms controlling the impact of multi‐year drought on mountain hydrology, Sci. Rep., 8(1), 690, https://doi.org/10.1038/s41598-017-19007-0.
Dralle, D. N., et al. (2020), Plants as sensors: Vegetation response to rainfall predicts subsurface water storage capacity in Mediterranean climates, EarthArXiv, https://doi.org/10.31223/osf.io/py734.
Goulden, M. L., and R. C. Bales (2019), California forest die-off linked to multi-year deep soil drying in 2012–2015 drought, Nat. Geosci., 12, 632–637, https://doi.org/10.1038/s41561-019-0388-5.
Graham, R. C., A. M. Rossi, and K. R. Hubbert (2010), Rock to regolith conversion: Producing hospitable substrates for terrestrial ecosystems, GSA Today, 20(2), 4–9, https://doi.org/10.1130/GSAT57A.1.
Hahm, W. J., et al. (2019a), Lithologically controlled subsurface critical zone thickness and water storage capacity determine regional plant community composition, Water Resour. Res., 55(4), 3,028–3,055, https://doi.org/10.1029/2018WR023760.
Hahm, W. J., et al. (2019b), Low subsurface water storage capacity relative to annual rainfall decouples Mediterranean plant productivity and water use from rainfall variability, Geophys. Res. Lett., 46(12), 6,544–6,553, https://doi.org/10.1029/2019GL083294.
Klos, P. Z., et al. (2018), Subsurface plant-accessible water in mountain ecosystems with a Mediterranean climate, WIREs Water, 5(3), e1277, https://doi.org/10.1002/wat2.1277.
Lebedeva, M. I., and S. L. Brantley (2020), Relating the depth of the water table to the depth of weathering, Earth Surf. Processes Landforms, 45(3), 2,167– 2,178, https://doi.org/10.1002/esp.4873.
O’Geen, A., et al. (2018), Southern Sierra Critical Zone Observatory and Kings River Experimental Watersheds: A synthesis of measurements, new insights, and future directions, Vadose Zone J., 17(1), 180081, https://doi.org/10.2136/vzj2018.04.0081.
Rempe, D. M., and W. E. Dietrich (2018), Direct observations of rock moisture, a hidden component of the hydrologic cycle, Proc. Natl. Acad. Sci. U. S. A., 115(11), 2,664–2,669, https://doi.org/10.1073/pnas.1800141115.
Riebe, C. S., W. J. Hahm, and S. L. Brantley (2017), Controls on deep critical zone architecture: A historical review and four testable hypotheses, Earth Surf. Processes Landforms, 42(1), 128–156, https://doi.org/10.1002/esp.4052.
Roche, J. W., et al. (2020), Evapotranspiration mapping for forest management in California’s Sierra Nevada, Frontiers. For. Global Change, 3, 69, https://doi.org/10.3389/ffgc.2020.00069.
Rungee, J., R. Bales, and M. Goulden (2019), Evapotranspiration response to multiyear dry periods in the semiarid western United States, Hydrol. Processes, 33(2), 182–194, https://doi.org/10.1002/hyp.13322.
Author Information
Roger C. Bales ([email protected]), University of California, Merced; and William E. Dietrich, University of California, Berkeley
Citation:
Bales, R. C.,Dietrich, W. E. (2020), Linking critical zone water storage and ecosystems, Eos, 101, https://doi.org/10.1029/2020EO150459. Published on 14 October 2020.
Text © 2020. The authors. CC BY-NC-ND 3.0
Except where otherwise noted, images are subject to copyright. Any reuse without express permission from the copyright owner is prohibited.