
Along the sloping margins of most of the world’s continents, underwater canyons and channel systems extend from sources on land to sinks in the deep sea. These submarine channels, which share many similarities of form and function with rivers on land, are critical in Earth’s sedimentary and biogeochemical cycles. They not only distribute eroded continental material to the deep sea, but they also redistribute carbon and vital nutrients such as iron, calcium, phosphorus, and sulfur across Earth’s surface.
The Bengal Channel, for example, carries massive quantities of eroded sediment from the Himalayas to the Indian Ocean and accounts for 10%–20% of the global burial of organic carbon [Galy et al., 2008]. Because they deliver and bury carbon, submarine channels play important roles in long-term sequestration—and therefore in climate over geologic timescales—as well as in the manufacture of hydrocarbons and reservoir rock in deepwater systems along continental margins. Discoveries of such systems in the past 20 years have become major players in global estimates of hydrocarbon resources [e.g., Zhang et al., 2019].
Just as rivers are formed by the erosive action of water currents, submarine channels are formed by erosive turbidity currents.
Just as rivers are formed by the erosive action of water currents, submarine channels are formed by erosive turbidity currents. Turbidity currents comprise dense, sediment-laden flows that travel down sloped seafloors under the force of gravity [Meiburg and Kneller, 2010], often at high speeds up to 20 meters per second (72 kilometers per hour, or about 10 times the average speed of the Gulf Stream, the fastest-moving ocean current).
On the modern seafloor, deepwater submarine channels longer than 100 kilometers are generally found in association with deep-sea fans made of sediments from major river systems. In addition to the Bengal Channel, which lies seaward of the Ganges and Brahmaputra Rivers, examples include channels and fans seaward of the Amazon, Congo, Indus, Mississippi, and Nile Rivers.
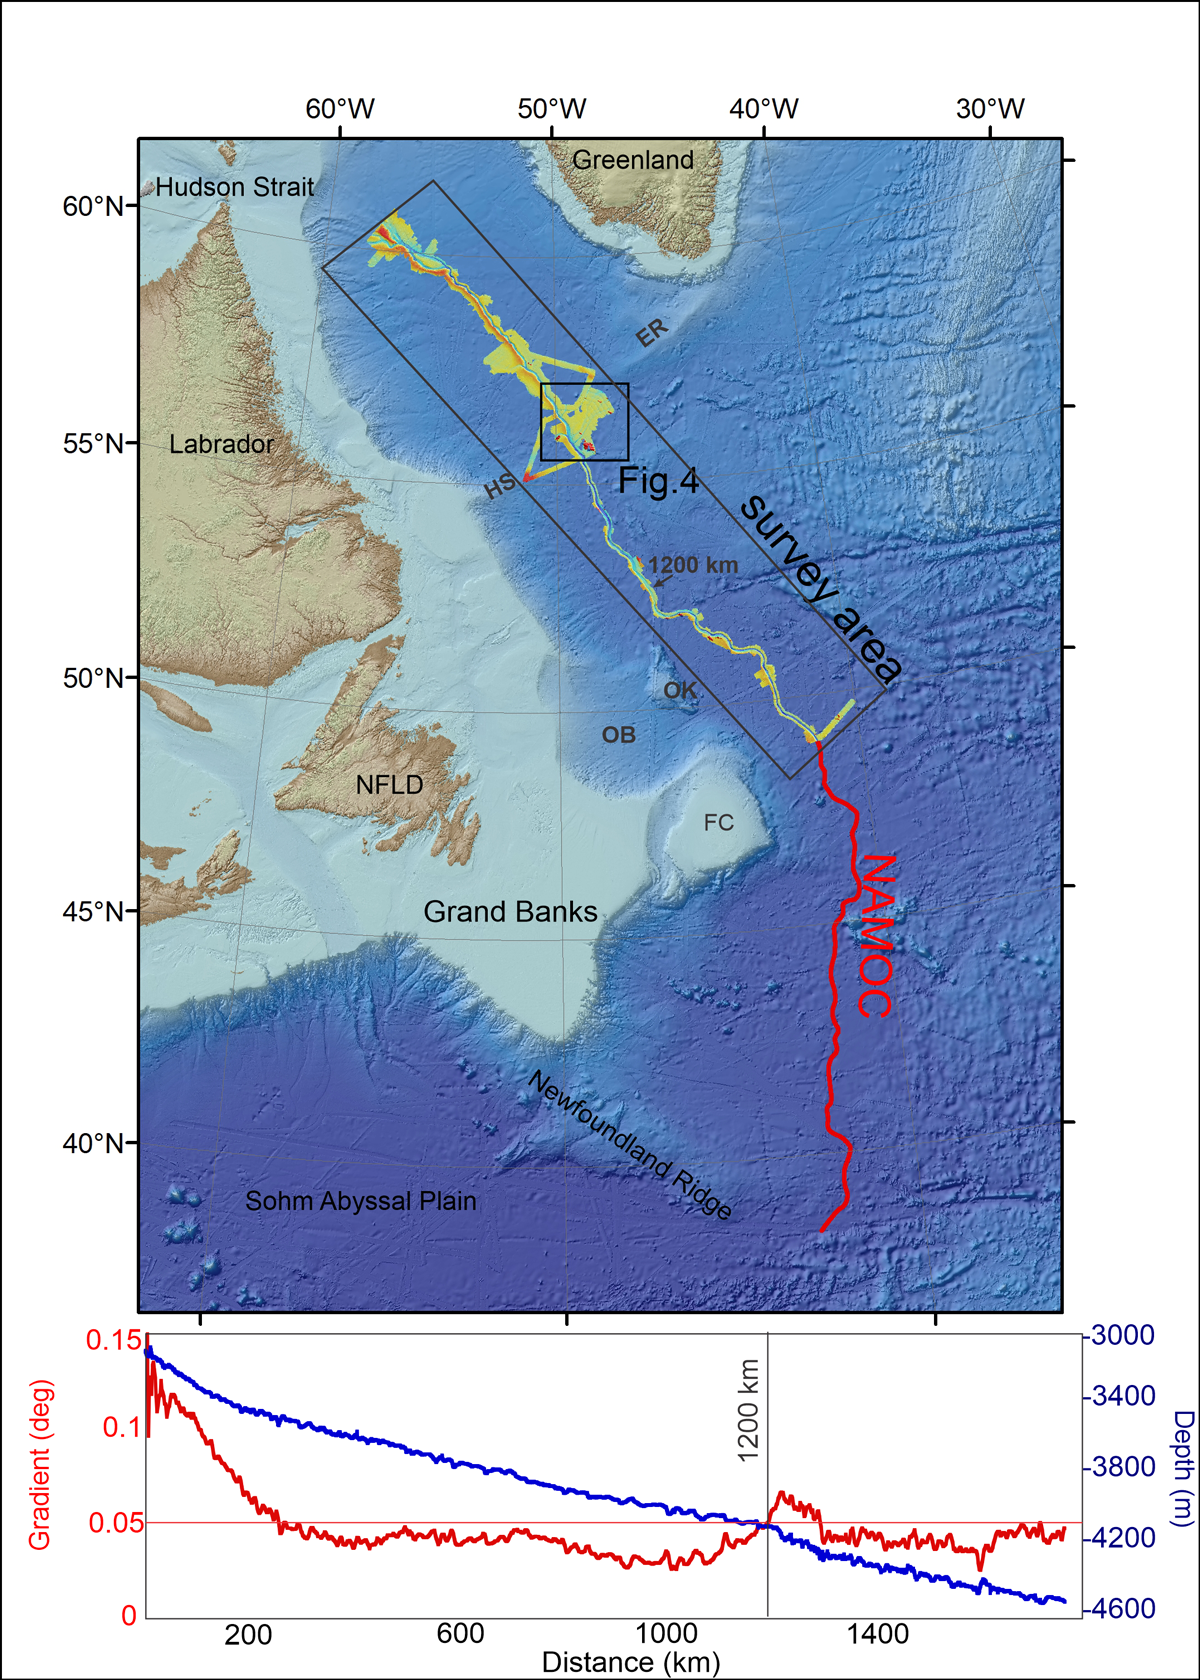
One of the longest, if not the longest, submarine channels in the world, however, is not associated with sediment sourced from a river or deep-sea fan, but rather with outwash from melting glaciers. The Northwest Atlantic Mid-Ocean Channel (NAMOC) wends its way for more than 3,800 kilometers from Hudson Strait—which connects Hudson Bay to the Atlantic—in the north, through the Labrador Sea, and around the Grand Banks of Newfoundland before terminating at the northern limit of the Sohm Abyssal Plain, just east of Newfoundland Ridge (Figure 1). Although first observed in 1949 and subsequently studied and mapped further through the 20th century using technologies of the day [e.g., Ewing et al., 1953; Hesse et al., 1996], many questions about its formation remain unresolved because of the absence of detailed knowledge of its morphological and structural features.
Submarine channels, despite being major features in ocean basins, sometimes do not appear on regional bathymetric charts because grid sampling of complex bathymetric data sets—the technique by which most modern charts are rendered—is too coarse to adequately capture the relatively narrow channels. NAMOC, for example, which is generally less than 5 kilometers wide, was not imaged on the 2008 version of the General Bathymetric Chart of the Oceans (GEBCO) when the chart was produced from a 60–arc second (roughly 1,850-meter) sample interval grid. To map the full extent of these channels in detail, therefore, researchers cannot rely on generic legacy data sets but must have dedicated surveys.
Such detailed mapping helps answer questions about the Northwest Atlantic Mid-Ocean Channel (NAMOC) and will lead to better understanding of the physical processes involved in deep-sea sediment transport.
The principal objective of expedition 102 on the German R/V Maria S. Merian (MSM102) in summer 2021 was to use multibeam bathymetric sonar to map morphologic details over much of the length of the NAMOC (Figure 1). Such detailed mapping not only helps answer questions about the NAMOC itself but will also lead to better understanding of the physical processes involved in deep-sea sediment transport, allow for detailed comparisons of submarine channels and terrestrial river systems, and offer opportunities to examine the roles of turbidity currents, the Coriolis force, sediment mass failures, and other factors in producing such critical and scientifically interesting features.
Formation of the NAMOC in the Labrador Sea
The Labrador Sea, located between Canada’s Labrador coast and Greenland and home to the portion of the NAMOC mapped during the MSM102 expedition (Figure 1), began forming roughly 60 million years ago as seafloor spreading in the Atlantic propagated northward. Spreading in the Labrador Sea ceased about 40 million years ago [Roest and Srivastava, 1989] and was followed by tectonic compression that led to deformation and shoaling of the basin. The basin’s modern surface, however, largely resulted from Pleistocene glacial epochs over roughly the past 2.6 million years. As evidence of these glaciations, glacial till extends to the outer shelf and uppermost slope along most of the eastern Canadian continental margin [Piper et al., 2012; Shaw et al., 2014].
It is believed that the most profound influences on the basin’s modern geomorphology resulted from high sediment fluxes that caused intensified hyperpycnal and turbidity current flows during glacial melt episodes over the past 60,000 years, especially commencing about 20,000 years ago during the collapse of the Laurentide Ice Sheet, which covered most of present-day Canada and the northern United States. Since most of this glacial input derived from the North American landmass, the basin has an asymmetric bowl shape. The west side of the basin has a more rounded concave shape, whereas the east side has a flatter seafloor abutting a steep gradient along the Greenland margin. The entire basin dips gently, by less than 0.1°, to the south.
Hudson Strait, leading from Hudson Bay at the northern extent of the Labrador Sea, was a major outlet for the Laurentide Ice Sheet throughout the late Pleistocene [Margold et al., 2015]. Its deep shelf break at 600 meters water depth and eroded uppermost slope imply that major ice streams occupied the strait—ice streams that drained much of northern North America. This geographically confined source of sediment at the northern end of the Labrador Sea and the sea’s bowl shape and southern dip, which together form a broad funnel, are critical factors in the formation of NAMOC.
Mapping NAMOC
Scientists and crew aboard the R/V Maria S. Merian sailed on a 7-week expedition to map roughly 2,000 kilometers of the NAMOC in greater detail than ever before.
Scientists and crew aboard the R/V Maria S. Merian sailed from Emden, Germany, on a 7-week expedition between late July and early September 2021 to map roughly 2,000 kilometers of the NAMOC in greater detail than ever before. The objective was to follow the axis of the channel and run a series of orthogonal profiles to image its morphology and structure, from just east of Orphan Knoll to the northern extent of Labrador Sea (Figure 1).
Protocols enforced because of COVID-19 limited the ability of several of the expedition proponents to participate, but otherwise, few obstacles were encountered. Surprisingly for the Labrador Sea, conditions were remarkably calm, and there was no time lost to bad weather, although overcast skies and frequent fog were typical.
The Merian is equipped with a hull-mounted multibeam bathymetric mapping system with a maximum beam coverage of 150°, meaning that on a single pass, it can map a swath of seafloor up to 7 times as wide as the water is deep. Each swath consists of a maximum of 432 beams; thus, during MSM102 enough data were acquired to allow, at a minimum, a depth sounding every 100 meters (i.e., producing a 100- × 100-meter grid for the entire data set). In addition, coincident data were acquired with a subbottom profiler that yielded submeter vertical resolution and allowed imaging to 100 meters depth below the seafloor.
Several remarkable characteristics of NAMOC are immediately apparent from complete mapping of the northern half of the channel during MSM102 together with transit data from other expeditions that crossed portions of its southern extent. These observations shed light on the NAMOC, its formation, and how it compares with other submarine channels. They also raise interesting questions with implications for processes that control sediment transport, carbon burial, and other processes of the deep ocean.
The River Analogy
Comparisons between deep-sea channels and river systems are common in the literature. However, there are fundamentally different physical processes at play. The sediment-laden turbidity currents that form subsea channels, such as NAMOC, are aperiodic [Meiburg and Kneller, 2010], and many of their properties, including their downslope velocities, are largely dictated by flow volume and the density contrast between the flow and the ambient fluid (seawater) in addition to the gravitational force acting along the seafloor gradient. As the front portions of turbidity currents are known to hydroplane, the bed substrate (seafloor) has little bearing on the nature of these flows, which show their highest velocities close to the seabed as a result.
Although deep-sea channels and rivers have analogous characteristics, these features likely result from different hydraulic and sedimentologic processes.
In contrast, river flows continuously erode their channels and are dictated entirely by gravity (gradient), channel dimensions, flow volume, and the roughness of the riverbed substrate. The ambient fluid (air) is not a significant factor because the density of air is so low that it does not affect the flow of water. Because of bed friction, river currents are generally fastest toward the top surface of the flow. There are other distinctions, of course, but the conclusion is that although deep-sea channels and rivers have analogous characteristics, these features likely result from different hydraulic and sedimentologic processes.
The NAMOC shows features that appear similar to point bars and thalwegs within the channel (Figure 2), both common features of river systems. Point bars in river systems have tabular, cross-bedded internal structures, but profiles of these deposits within NAMOC show no such evidence. Detailed mapping during the MSM102 expedition shows that these point bars are predominately composed of material from channel levee collapses (i.e., submarine slumps). The collapsed material appears to have been reworked by subsequent turbidity currents, which is apparent from their elongated shape with surficial bed forms, while at the same time forcing subsequent currents into a narrow region of the main channel opposite the deposit.
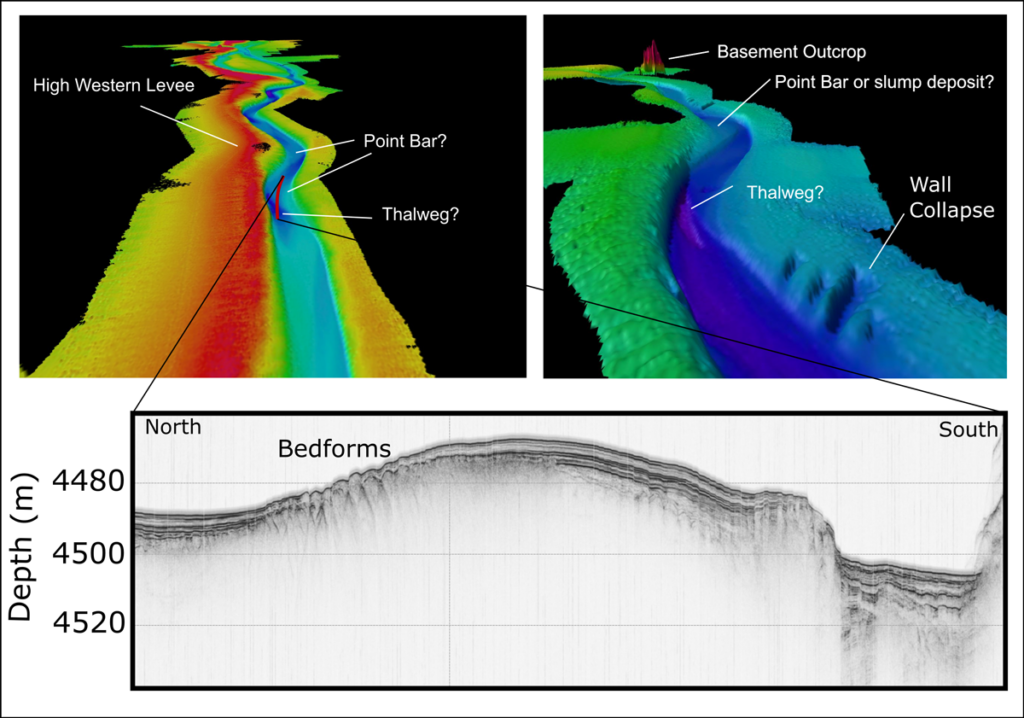
This forcing effect appears to create thalweg-like features amid the otherwise flat-bottomed profile of the channel. The wall collapses may thus bear some responsibility for creating meanders in the NAMOC (Figure 2), which in turn result in its “thalweg” consisting of short, discontinuous segments. In comparison, thalwegs in river channels are typically continuous. These intriguing features require additional research that specifically addresses the physical processes that created them [Azpiroz-Zabala et al., 2017].
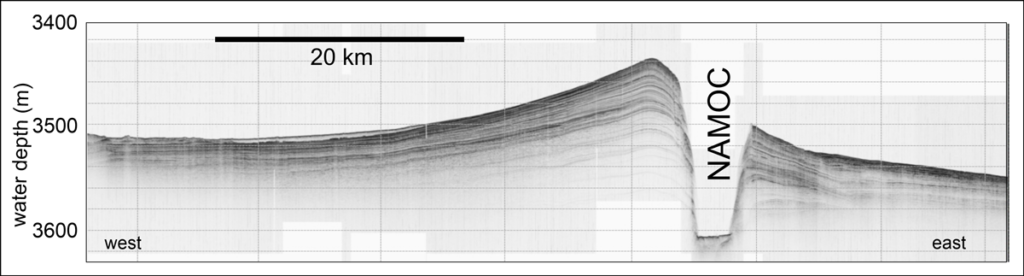
Rivers and submarine channels are both known to construct channel levees. The banks of the NAMOC are lined with levees tens of meters tall; however, the western levee is consistently higher than the eastern levee by as much as 50 meters for much of its entire length (Figure 3). This characteristic feature resulted from the Coriolis force, which caused suspended sediment that overtopped the channel to preferentially deposit on the western side as Earth rotated beneath the cloud of suspended sediment. (The Coriolis force does not influence channel levee deposition for rivers on land.) The NAMOC levee asymmetry was observed when the channel was first discovered and was first ascribed to tectonic tilting of the basin. New data from MSM102 permit a continuous comparison of levee heights along the NAMOC, which will allow finite quantification of the Coriolis effects because the channel crosses some 20° of latitude.
Channel Morphology and Gradient
New data acquired during expedition MSM102 also allow calculation of a continuous gradient profile (Figure 1). Previously, gradients along much of the NAMOC could only be interpolated using bathymetry collected during discrete crossings of the channel. These new data show, for example, that although NAMOC has a relatively consistent overall gradient of only about 0.05°, there are subtle deviations that correspond to changes in channel architecture. For example, at about the 1,200-kilometer point in the new bathymetric profile (Figure 1), there is an increase in gradient that corresponds to an initial shoaling of the channel prior to its deepening and the formation of higher-amplitude and broader meander bends. With the new data, it will be possible to conduct detailed modeling of flow hydrodynamics that can be related to channel characteristics.
Currents are typically slow in low-gradient river systems, which also tend to have highly meandering paths: the Nile, which is about the same length as the NAMOC and has a similar gradient, is a good example. Similarly, the Congo submarine channel has an overall gradient of just over 0.5° and is highly meandering [Savoye et al., 2009]. It was thus expected that the NAMOC’s low gradients should result in significant meandering, yet as we see in the new mapping, it has few meanders, and those it does have are of low amplitude (Figures 1 and 2).
Understanding flow concentrations in the NAMOC bears significantly on the objectives of surveying efforts in terms of determining the role of submarine channels in transporting and redistributing critical elements, such as nutrients and carbon, to the deep sea.
The velocities of flows within NAMOC have not yet been estimated, but it is possible that velocities were high and that flow velocity is more critical than slope gradient and the Coriolis effect in determining the degree of meandering in submarine channels. As mentioned previously, density contrasts between turbidity currents and ambient seawater are a major control on flow velocities. If flow velocities were high in the NAMOC system, then high-concentration flows were likely prevalent. Understanding flow concentrations in the NAMOC bears significantly on the objectives of surveying efforts in terms of determining the role of submarine channels in transporting and redistributing critical elements, such as nutrients and carbon, to the deep sea.
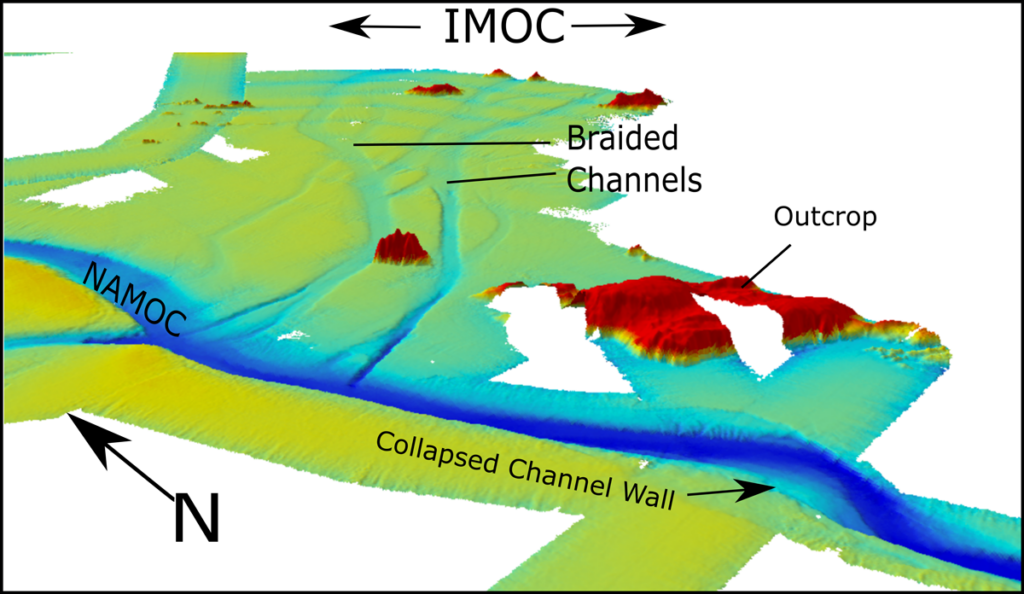
One of the more interesting features revealed by the MSM102 survey is the confluence of NAMOC and the Imarssuak Mid-Ocean Channel (IMOC), which originates along the southern Greenland continental margin (Figures 1 and 4). The data show IMOC to be a shallow, braided system, distinct from the single-channel NAMOC. It’s unclear what fundamental differences in these systems generated such vastly different morphologies, but presumably, they are related to the sources of the turbidity currents that formed them. Perhaps IMOC was generated by turbidity currents derived in multiple locations rather than a confined or point source. Perhaps also the flows were of lower concentration or consisted of different grain sizes. These factors have yet to be investigated but will likely inform us about the regional variability of deglaciation in the North Atlantic.
Scientists studying the NAMOC have already learned a great deal from the mapping collected last summer, yet the characteristics described above reflect only initial observations and interpretations. Much work remains to integrate these data with data from sediment cores and multichannel seismic reflection experiments that were also acquired during MSM102, as well as with existing data. This continuing work is necessary to understand more completely the geologic history of this unique submarine channel system and the glacial and sedimentary processes that created it.
Acknowledgments
Shipboard and shore-based participants in MSM102 include F. Bahr, R. Barrett, L. Baumann, M. Felgendreher, K. Gross, R. Hägele, A. Hinz, H. Jähmlich, I. Klaucke, P. Knutz, K.-F. Lenz, J. Liebsch, G. von Rönn, A. Schmitz, C. Stevenson, V. Thamm, and C. Wallmeier. Scientific staff appreciate immensely the support of the officers and crew of the R/V Maria S. Merian during the expedition. The expedition was funded by the Deutsche Forschungsgemeinschaft. Bathymetric data from MSM102 will be contributed to the SEABED 2030 initiative, which is compiling all available bathymetric data to produce the definitive map of the world ocean floor by 2030 and make it publicly available. All data will eventually be made available in the PANGAEA database.
References
Azpiroz-Zabala, M., et al. (2017), A general model for the helical structure of geophysical flows in channel bends, Geophys. Res. Lett., 44, 11,932–11,941, https://doi.org/10.1002/2017GL075721.
Ewing, M., et al. (1953), Exploration of the Northwest Atlantic Mid-Ocean Canyon, Geol. Soc. Am. Bull., 64, 865–868, https://doi.org/10.1130/0016-7606(1953)64[865:EOTNAM]2.0.CO;2.
Galy, V., et al. (2008), Recycling of graphite during erosion: A geological stabilization of carbon in the crust, Science, 322, 943–945, https://doi.org/10.1126/science.1161408.
Hesse, R., et al. (1996), Imaging Laurentide Ice Sheet drainage into the deep sea: Impact on sediments and bottom water, GSA Today, 6(9), 3–9, www.geosociety.org/gsatoday/archive/6/9/pdf/i1052-5173-6-9-sci.pdf.
Margold, M., et al. (2015), Ice streams in the Laurentide Ice Sheet: A new mapping inventory, J. Maps, 11(3), 380–395, https://doi.org/10.1080/17445647.2014.912036.
Meiburg, E., and B. Kneller (2010), Turbidity currents and their deposits, Annu. Rev. Fluid Mech., 42, 135–156, https://doi.org/10.1146/annurev-fluid-121108-145618 .
Piper, D. J. W., et al. (2012), Erosional and depositional features of glacial meltwater discharges on the eastern Canadian continental margin, in Application of Seismic Geomorphology Principles to Continental Slope and Base-of-Slope Systems, edited by B. Prather et al., Spec. Publ. SEPM Soc. Sediment. Geol., 99, 61–80, https://doi.org/10.2110/pec.12.99.0061.
Roest, W. R., and S. P. Srivastava (1989), Sea-floor spreading in the Labrador Sea: A new reconstruction, Geology, 17, 1,000–1,003, https://doi.org/10.1130/0091-7613(1989)017%3C1000:SFSITL%3E2.3.CO;2.
Savoye, B., et al. (2009), Geological overview of the Angola-Congo margin, the Congo deep-sea fan and its submarine valleys, Deep Sea Res., Part II, 56(23), 2,169–2,182, https://doi.org/10.1016/j.dsr2.2009.04.001.
Shaw, J., et al. (2014), Continental shelves of Atlantic Canada, Mem. Geol. Soc. London, 41, 7–19, https://doi.org/10.1144/m41.2.
Zhang, G., et al. (2019), Giant discoveries of oil and gas fields in global deepwaters in the past 40 years and the prospect of exploration, J. Nat. Gas Geosci., 4, 1–28, https://doi.org/10.1016/j.jnggs.2019.03.002.
Author Information
Sebastian Krastel, Institute of Geosciences, Christian-Albrechts-Universität zu Kiel, Germany; and David C. Mosher ([email protected]), Atlantic Division, Geological Survey of Canada, Dartmouth, NS, Canada