The global nature of climate change means that all environments show evidence of abnormal change: continually rising average temperatures and increases in sea level that inundate coastal areas, along with an increase in the frequency and intensity of severe weather such as hurricanes, typhoons, and tropical storms.
The latest version of lidar collects data from three lasers at once, producing multispectral images that catch details a single-laser scan would miss.
New technologies provide ever-clearer images and more detailed data on these effects and how they evolve from year to year. One such technology, lidar (light detection and ranging), is the laser equivalent of radar. The instrument sits aboard an aircraft that flies back and forth over an area, collecting data that are processed to produce a three-dimensional image of the surfaces below. The latest version of lidar collects data from three lasers at once, producing multispectral images that catch details a single-laser scan would miss.
Geoscientists are putting this new capability to work, monitoring landscape features crafted by melting ice in frigid regions, providing data for storm surge and sea level rise models for the Gulf of Mexico, and monitoring an ecosystem’s recovery from a massive oil spill.
Lidar Goes from Black-and-White to “Color”
Lidar originated in the mid-1930s in the atmospheric research community. Evolutions and refinements in this technology have enabled breakthroughs in various fields of the geosciences [Fernandez-Diaz et al., 2013].
The first airborne mapping lidar instruments were developed in 1966 to map Arctic pack ice [Ketchum, 1971] and hunt for submarines [Sorenson et al., 1966]. However, it was not until the end of the 1990s that the enabling technologies—including satellite systems, navigation sensors, lasers, and detectors—were mature enough to produce the high resolution and accuracy in the topographic data that geophysical research requires [Slatton et al., 2007].
During an airborne lidar survey, an aircraft outfitted with a laser emitter and a sensor scans a swath of surface below the flight path. Laser pulses, emitted at rates of hundreds of thousands of pulses per second, bounce back from the surface below, and these “returns” are picked up by the lidar sensor. By analyzing how long it takes the laser’s pulse to return to the sensor, a computer can determine the distance to the reflecting surface. Simultaneously, GPS receivers and inertial measuring units collect position and orientation data that enable determination of the aircraft’s trajectory to within 10 centimeters.
Later, the range data are combined with aircraft trajectory and other data to produce a highly accurate “point cloud,” a set of data points containing information on the three-dimensional coordinates of the reflecting surface and the intensity, or relative strength, of each recorded return.
Algorithms classify the likely sources of the returns as vegetation, artificial structures, ground surfaces, or other sources. Further processing of the point cloud generates digital elevation models. Depending on the science requirements, flight plans and sensor configurations can provide digital elevation models of the topography at resolutions of a few tens of centimeters horizontally and a few centimeters vertically [Glennie et al., 2013].
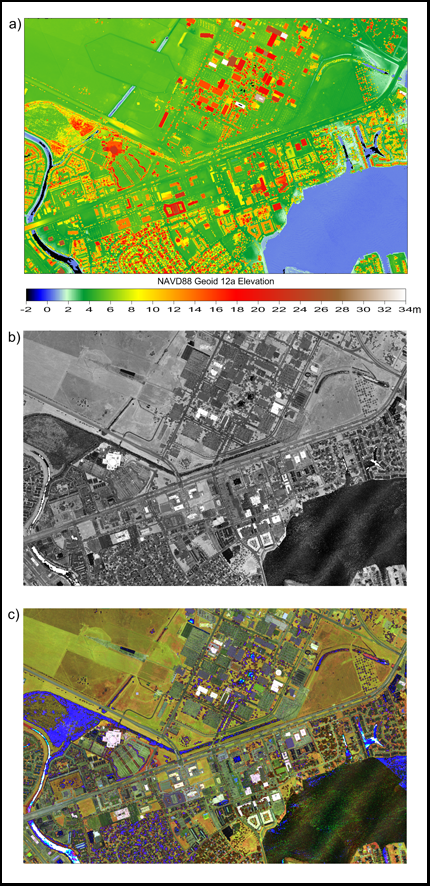
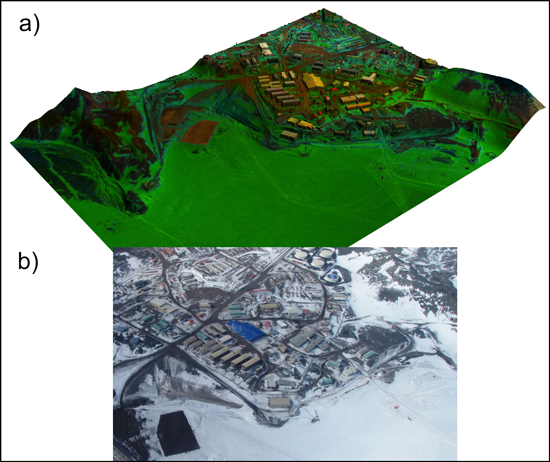
Traditional mapping lidars provide rich and accurate three-dimensional data (Figure 1a) as point clouds and digital elevation models. They also produce “intensity” images that are the equivalent of aerial black-and-white photographs (Figure 1b). The spectral data from these intensity images are monochromatic, limited to a measure of the laser backscatter at the specific laser wavelength. Various laser wavelengths provide additional information on the terrain below, but before now, gathering this information required compiling data collected from several lidar sensors operating at different wavelengths.
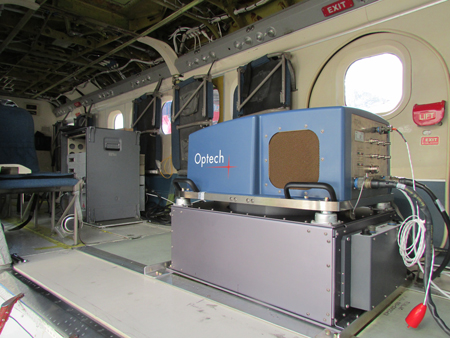
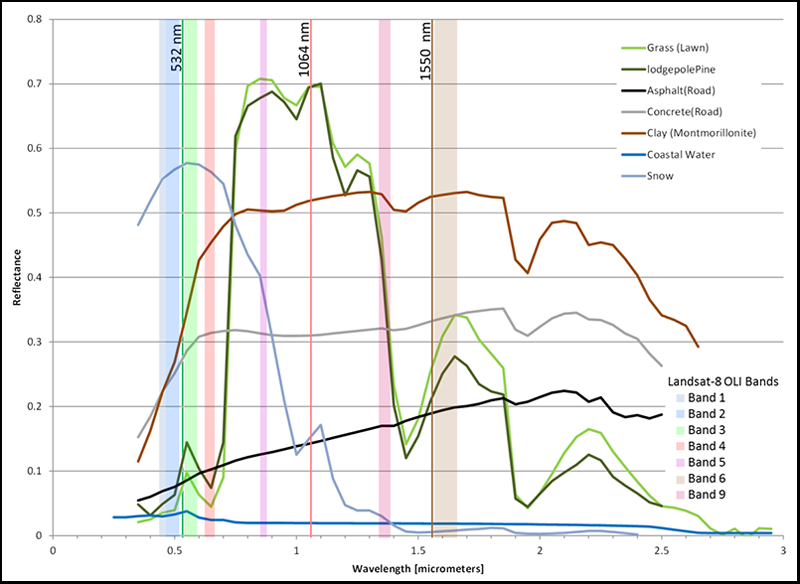
The Optech Titan multispectral airborne laser scanner (ALS) is the first operational system designed to perform mapping at three different wavelengths simultaneously through the same scanning mechanism. The Titan collects data at near-infrared wavelengths (1550 and 1064 nanometers (nm)) and near the center of the visible light spectrum (532 nm; Figure 2). This three-wavelength capability enables users to map elevations above sea level (topography) and depths below sea level (bathymetry) simultaneously at high resolution.
This three-channel spectral information can be combined into false-color laser backscatter images, which improve researchers’ ability to distinguish between varied types of land cover (Figure 1c). Combining the three-dimensional spatial and three-channel spectral information yields a new kind of data set (Figure 3) that previously was only available combining lidar data (which actively illuminates the target) with passive imagery (which gathers ambient light reflected by the target and can vary with sunlight conditions).
The U.S. National Science Foundation’s National Center for Airborne Laser Mapping (NCALM) had the opportunity to explore the capabilities of this novel sensor in regions as different as the McMurdo Dry Valleys of Antarctica and the rain forests of Central America during the first year of its deployment. They collected data for investigators studying the consequences and effects of climate change and other ecological disasters. These efforts, aimed at understanding how our planet and its climate are changing at relatively small scales and high resolutions, complement ongoing efforts to study similar changes at global scales and lower resolutions [Intergovernmental Panel on Climate Change (IPCC), 2013].
Melting Ice in the McMurdo Dry Valleys
Even though scientists were aware as early as the mid-1970s of the negative climate effects from increased levels of atmospheric carbon dioxide (CO2) [Mercer, 1978], it has taken decades for them to gather and analyze data quantifying these effects across the globe [IPCC, 2013]. Many of the most visible effects are related to melting ice at high latitudes.
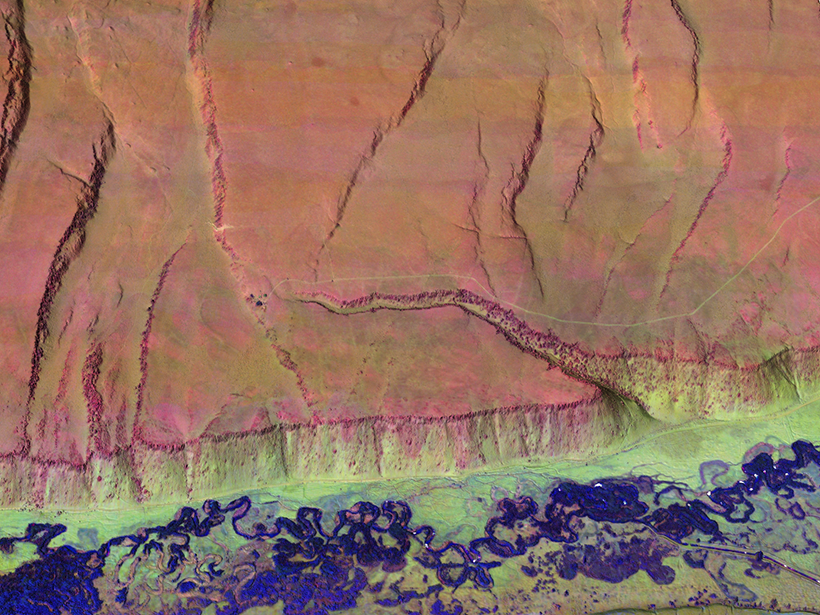
The frozen water that constitutes the cryosphere is critically important, and it is mainly concentrated in the Arctic, Greenland, and Antarctica [Vaughan et al., 2013]. Andrew Fountain of Portland State University leads a group of scientists that is studying the causes and effects of melting subsurface ice in the Dry Valleys near McMurdo Station in Antarctica (Figure 3). They are particularly interested in detecting the small changes on the valley’s topography caused by melting permafrost (thermokarsts) as well as mapping their extent throughout the valley system [Fountain et al., 2014].
To map the current surface, NCALM flew the Titan multispectral ALS on a Twin Otter aircraft over a surface area of more than 3500 square kilometers for a 6-week period during the austral summer of 2014–2015. NCALM and the science team are in the process of developing change detection maps that will enable the identification of the thermokarsts by comparing this recent data set to a previous one collected by NASA with the Airborne Topographic Mapper in the austral summer of 2001–2002 [Csatho et al., 2005].
Titan has an advantage over traditional airborne laser scanner systems for mapping areas like the McMurdo Dry Valleys where areas of soil and snow overlap.
Titan has an advantage over traditional ALS systems for mapping areas like the McMurdo Dry Valleys where areas of soil and snow overlap. A traditional ALS operating at 1550 nm would obtain strong returns from the soil surfaces but would have difficulties obtaining returns from the ice and snow, which reflect little light at that wavelength. The Titan can use the 1064- and 532-nm channels, which have better response to snow, at the same time it is collecting the 1550-nm data. Scientists working in the Dry Valleys and on monitoring the polar regions can use the resulting open-access data set to calibrate satellite data as they generate maps of other Antarctic regions.
Threat of Rising Seas near the Gulf of Mexico
In 2015, NCALM was commissioned to carry out an airborne topographic and bathymetric lidar survey of the area surrounding NASA’s Johnson Space Center in Houston, Texas. This center’s campus is 6 meters above sea level at its highest and surrounded by a network of streams, bayous, and lakes that connect to Galveston Bay (Figure 1a). The campus is less than 50 kilometers from the Gulf of Mexico, which is known as an incubator of major storm systems. In 2008, one such storm, Hurricane Ike, devastated the Houston metropolitan area, causing billions of dollars in property damage in Texas alone.
The effects of climate change might compound similar events. In preparation, this survey was designed to gather highly detailed spatial data to assist NASA in developing storm surge and sea level rise models. The Titan ALS is ideal for this project because it was specifically designed to carry out high-resolution seamless surveys in a single pass over areas where land meets water. William Stefanov of the Astromaterials Research and Exploration Science Division at the Johnson Space Center and his colleagues will use the information coming from this project to assess strategies and mechanisms to mitigate negative weather and climate effects on these NASA facilities.
Disasters of Human Origin
Titan’s multispectral data are being used to study other environmental issues, including monitoring the evolution of ecosystems affected by the Deepwater Horizon oil spill in the Gulf of Mexico in 2010. Five years after this environmental disaster, NCALM was called upon to assist in mapping wetlands in the Barataria Bay system along Louisiana’s Gulf Coast.
Data processing and analysis for this first-year deployment are still underway, and we will publish our results in science and engineering journals.
In this project, researchers from the Coastal Waters Consortium plan to supplement lidar data with hyperspectral imaging data, which produce not only images but the light spectrum of each pixel in the image. The hyperspectral data will be used to evaluate the presence or absence of pollutants, as well as the general health of the vegetation. Titan’s spatial data will be used primarily to estimate the biomass of the vegetation, and researchers will also assess how its active three-band multispectral data can complement the passive hyperspectral data. Information gathered in the survey will be used to study how the ecosystem responds to and evolves from exposure to the oil spill.
Data processing and analysis for this first-year deployment are still under way, and we will publish our results in science and engineering journals. We are hopeful that this new sensor and the enhanced spatial and spectral information it provides will lead to new applications and discoveries in the geosciences.
References
Csatho, B., T. Schenk, W. Krabill, T. Wilson, W. Lyons, G. McKenzie, C. Hallam, S. Manizade, and T. Paulsen (2005), Airborne laser scanning for high‐resolution mapping of Antarctica, Eos Trans. AGU, 86, 237–238, doi:10.1029/2005EO250002.
Fernandez-Diaz, J. C., W. E. Carter, R. L. Shrestha, and C. L. Glennie (2013), Lidar remote sensing, in Handbook of Satellite Applications, pp. 757–808, Springer, New York.
Fountain, A. G., J. S. Levy, M. N. Gooseff, David Van Horn (2014), The McMurdo Dry Valleys: A landscape on the threshold of change, Geomorphology, 225, 25–35.
Glennie, C. L., W. E. Carter, R. L. Shrestha, and W. E. Dietrich (2013), Geodetic imaging with airborne LiDAR: The Earth’s surface revealed, Rep. Prog. Phys., 76, 086801.
Intergovernmental Panel on Climate Change (IPCC) (2013), Climate Change 2013: The Physical Science Basis. Contribution of Working Group I to the Fifth Assessment Report of the Intergovernmental Panel on Climate Change, edited by T. F. Stocker et al., Cambridge Univ. Press, Cambridge, U.K.
Ketchum, R. D. (1971), Airborne laser profiling of the Arctic pack ice, Remote Sens. Environ., 2, 41–52.
Mercer, J. H. (1978), West Antarctic ice sheet and CO2 greenhouse effect: A threat of disaster, Nature, 271, 321–325.
Sorenson, G., R. Honey, and J. Payne (1966), Analysis of the use of airborne laser radar for submarine detection and ranging, Rep. NADC-AE-6613.
Slatton, K. C., W. E. Carter, R. L. Shrestha, and W. Dietrich (2007), Airborne laser swath mapping: Achieving the resolution and accuracy required for geosurficial research, Geophys. Res. Lett., 34, L23S10, doi:10.1029/2007GL031939.
Vaughan, D. G., et al. (2013), Observations: Cryosphere, in Climate Change 2013: The Physical Science Basis. Contribution of Working Group I to the Fifth Assessment Report of the Intergovernmental Panel on Climate Change, edited by T. F. Stocker et al., Cambridge Univ. Press, Cambridge, U.K.
Author Information
Juan Carlos Fernandez-Diaz, William E. Carter, Ramesh Shrestha, and Craig L. Glennie, National Center for Airborne Laser Mapping and Department of Civil and Environmental Engineering, University of Houston, Houston, Texas; email: [email protected]
Citation:
Fernandez-Diaz, J. C.,Carter, W. E.,Shrestha, R., and Glennie, C. L. (2016), Multicolor terrain mapping documents critical environments, Eos, 97, https://doi.org/10.1029/2016EO053489. Published on 14 June 2016.
Text © 2016. The authors. CC BY-NC-ND 3.0
Except where otherwise noted, images are subject to copyright. Any reuse without express permission from the copyright owner is prohibited.