• About
  • Special Reports
  • Topics
    • Climate
    • Earth Science
    • Oceans
    • Space & Planets
    • Health & Ecosystems
    • Culture & Policy
    • Education & Careers
    • Opinions
  • Projects
    • Postcards From the Field
    • ENGAGE
    • Editors’ Highlights
    • Editors’ Vox
    • Eos en Español
    • Eos 简体中文版
    • Print Archive: 2015–2025
  • Policy Tracker
  • Blogs
    • Research & Developments
    • The Landslide Blog
  • Newsletter
  • Submit to Eos
  • AGU.org
  • Career Center
  • Join AGU
  • Give to AGU
  • About
  • Special Reports
  • Topics
    • Climate
    • Earth Science
    • Oceans
    • Space & Planets
    • Health & Ecosystems
    • Culture & Policy
    • Education & Careers
    • Opinions
  • Projects
    • Postcards From the Field
    • ENGAGE
    • Editors’ Highlights
    • Editors’ Vox
    • Eos en Español
    • Eos 简体中文版
    • Print Archive: 2015–2025
  • Policy Tracker
  • Blogs
    • Research & Developments
    • The Landslide Blog
  • Newsletter
  • Submit to Eos
Skip to content
  • AGU.org
  • Career Center
  • Join AGU
  • Give to AGU
Eos

Eos

Science News by AGU

Support Eos
Sign Up for Newsletter
  • About
  • Special Reports
  • Topics
    • Climate
    • Earth Science
    • Oceans
    • Space & Planets
    • Health & Ecosystems
    • Culture & Policy
    • Education & Careers
    • Opinions
  • Projects
    • Postcards From the Field
    • ENGAGE
    • Editors’ Highlights
    • Editors’ Vox
    • Eos en Español
    • Eos 简体中文版
    • Print Archive: 2015–2025
  • Policy Tracker
  • Blogs
    • Research & Developments
    • The Landslide Blog
  • Newsletter
  • Submit to Eos

geodesy

Two maps of Earth show areas highlighted in red and blue. In the image called “nonelliptical geoid,” the darkest blue area is in the Indian Ocean. In the image labeled “nonhydrostatic geoid,” the darkest blue area is over Antarctica.
Posted inNews

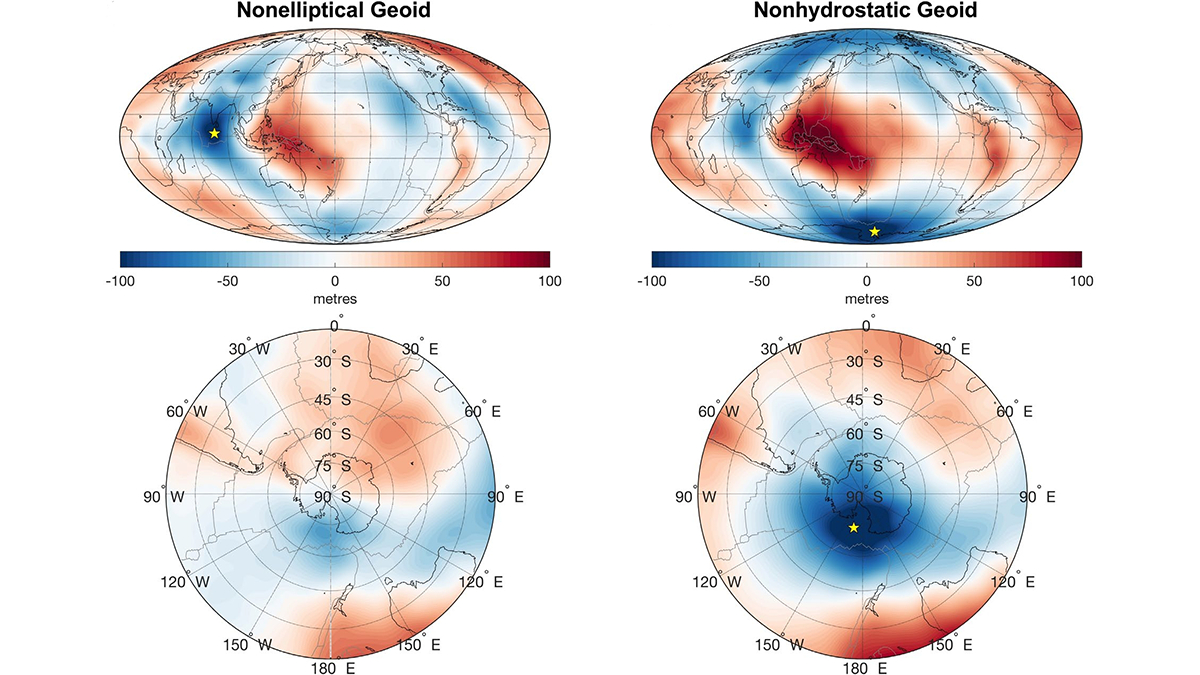
Scientists Remap Earth’s Gravity

by Tom Metcalfe 26 March 202626 March 2026

An uncommon way of looking at the world reveals the evolution of a deep gravity hole beneath Antarctica.

Maps from the article.
Posted inEditors' Highlights

Where the Tianshan Will Break Next: Strain, Slip, and Seismic Hazard

by Fabio A. Capitanio 14 January 20269 January 2026

Geodetic strain and slip deficits reveal where the Tianshan is storing stress and which faults may generate the next major earthquakes in the region.

Geologic map from the study.
Posted inEditors' Highlights

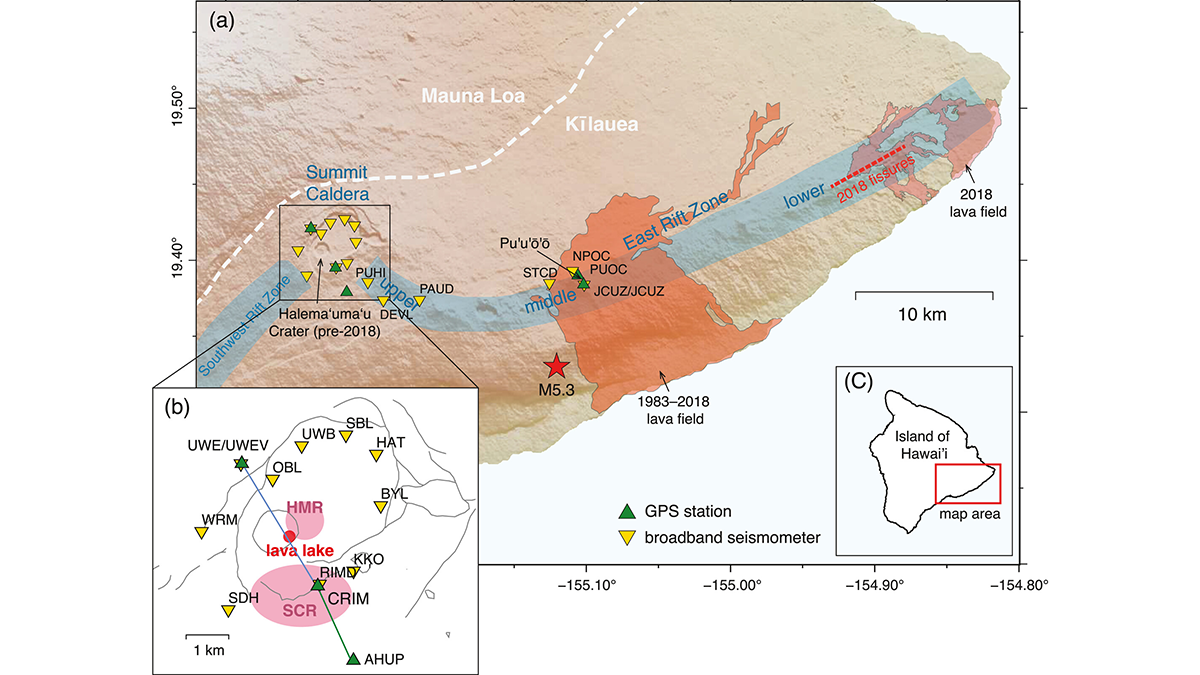
Complex Plumbing Dynamics for Kīlauea Volcano  

by Thorsten W. Becker 19 November 202519 November 2025

A new analysis of subtle seismic velocity changes provides insights into the coupling of magma reservoirs of Hawaiian volcanoes.

A telescope dome emits a green laser beam into the starry night sky.
Posted inNews

Bridging Old and New Gravity Data Adds 10 Years to Sea Level Record

Kimberly M. S. Cartier, News Writing and Production Intern for Eos.org by Kimberly M. S. Cartier 3 September 20253 September 2025

The remarkable agreement between the two techniques shows how scientists can bolster state-of-the-art gravimetry instruments with old-guard altimetry satellites.

New Orleans skyline
Posted inNews

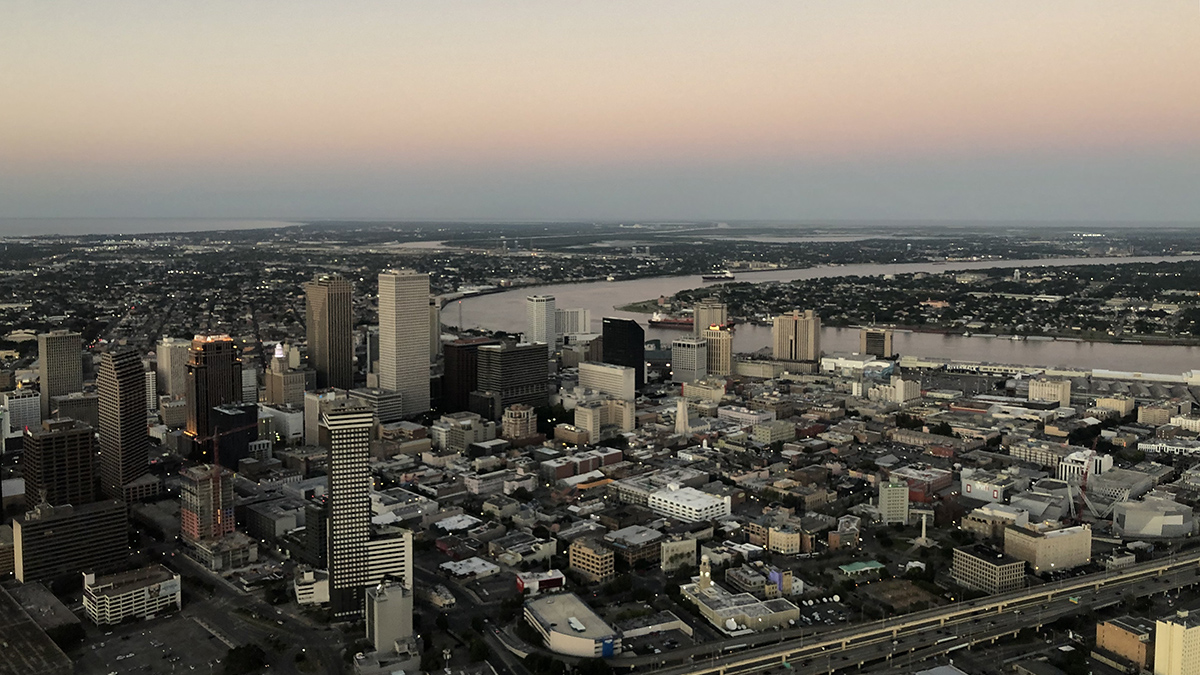
Parts of New Orleans Are Sinking

by Skyler Ware 14 August 202512 December 2025

Areas near the airport, along floodwalls, and in nearby wetlands are subsiding because of a combination of natural and anthropogenic forces.

Figure from the article.
Posted inEditors' Highlights

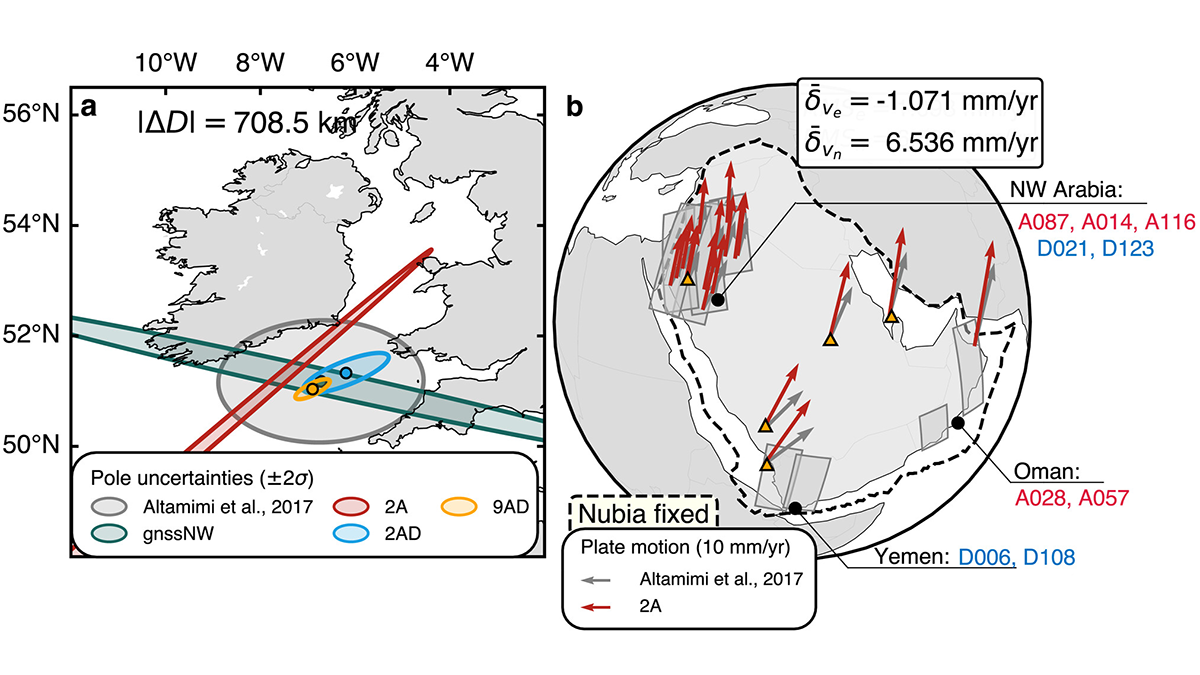
Mapping the Whereabouts of Continents

by Fabio A. Capitanio 24 July 202512 December 2025

A new method integrates Interferometric Synthetic Aperture Radar (InSAR) with conventional ground geodetic networks, taking us closer to high-resolution mapping of plate motions.

Houston's skyline seen from above
Posted inNews

33.8 Million People in the United States Live on Sinking Land

by Grace van Deelen 8 May 20258 May 2025

The most populated cities in the country are slowly subsiding, posing risks to infrastructure and exacerbating flooding—and not just on the coasts.

Map of the Iceland’s Reykjanes Peninsula.
Posted inEditors' Highlights

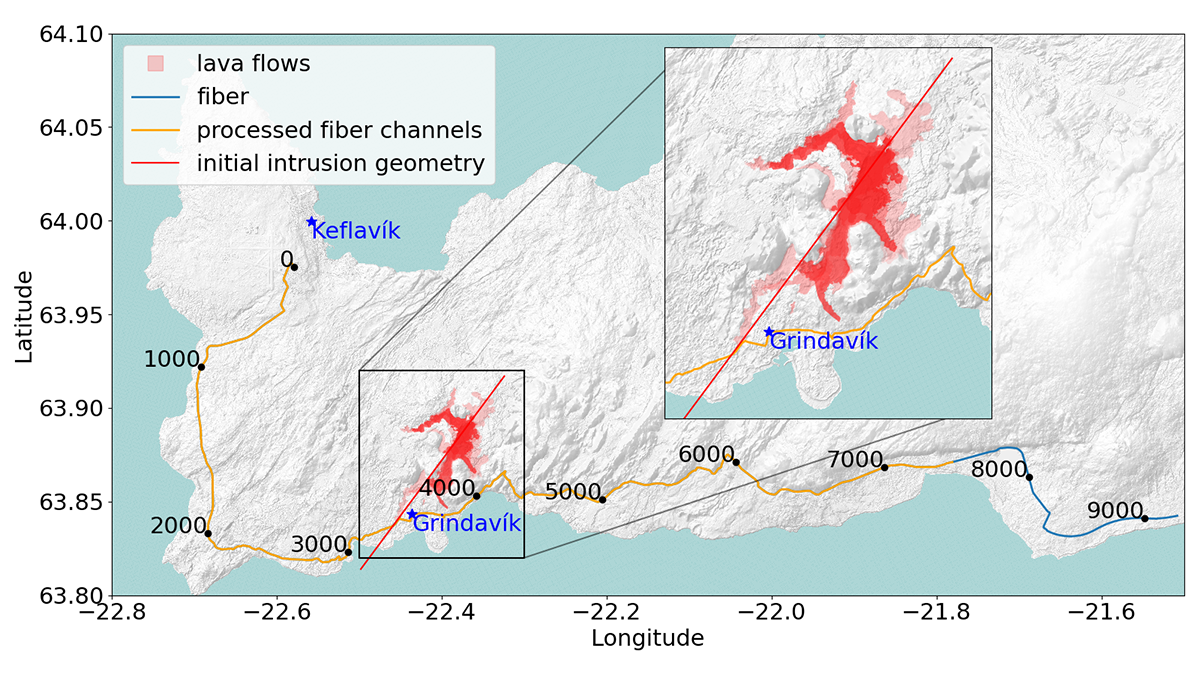
Observing Magma-Induced Seismic Velocity Changes with Fiber-Optics

by Marcos Moreno 26 February 202526 February 2025

A new high-resolution method for tracking volcanic activity utilizes fiber-optic sensing to detect magma intrusion by measuring seismic velocity changes.

A metal pole with a small gray-green dome, anchored to bare rock. Glacial ice is visible in the background.
Posted inNews

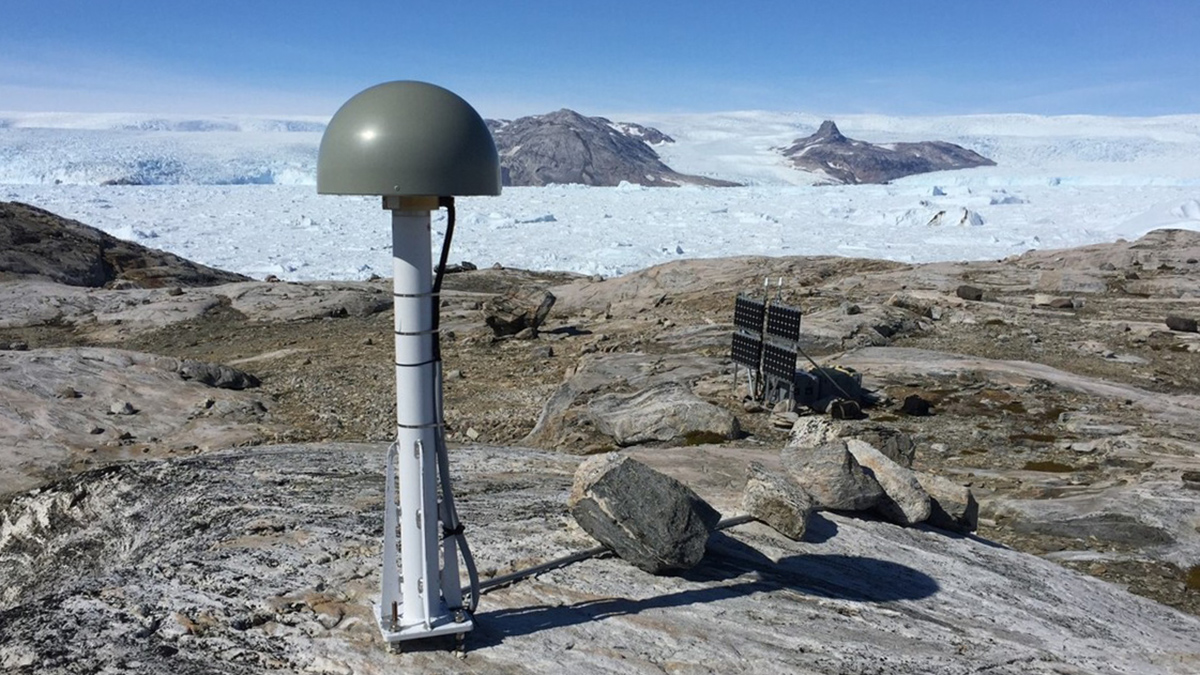
Greenland Ice Sheet Stores Hidden Water Throughout the Melt Season

by Matthew R. Francis 19 December 202419 December 2024

A new method uses stations around Greenland’s coast to measure how much meltwater weighs down the bedrock beneath the ice, improving our understanding of its contribution to sea level rise.

A satellite image of an atmospheric river over the ocean heading toward California
Posted inNews

California Storms Recharged Watersheds, Geodesy Data Reveal

by Caroline Hemphill 13 December 202413 December 2024

The atmospheric rivers that soaked the state in early 2023 released enough water to warp the ground and douse a deep drought.

Posts pagination

1 2 3 … 10 Older posts
Over a dark blue-green square appear the words Special Report: The State of the Science 1 Year On.

Features from AGU Publications

Research Spotlights

How Internal Waves Transport Energy Thousands of Miles Across the Ocean

26 March 202626 March 2026
Editors' Highlights

What’s Under the Water Matters

27 March 202626 March 2026
Editors' Vox

The Future of Earth’s Future

24 March 202624 March 2026
Eos logo at left; AGU logo at right

About Eos
ENGAGE
Awards
Contact

Advertise
Submit
Career Center
Sitemap

© 2026 American Geophysical Union. All rights reserved Powered by Newspack