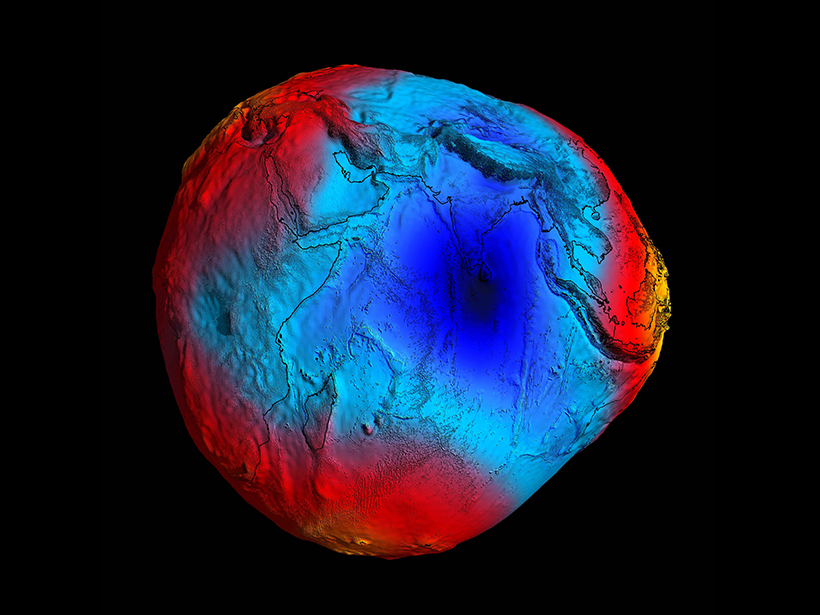
As our knowledge of Earth’s geometry has become more precise, we have come to realize that our planet is not a uniform sphere, as was previously believed. Earth’s rotation flattens it into an ellipsoid that is wider around the equator than around the poles. Heavy mineral deposits, deep-sea trenches, and magma reservoirs alter the distribution of mass, distorting Earth’s gravitational field on regional scales. The source of the largest equipotential gravitational field distortion in the world, a 106-meter anomaly in the Indian Ocean, remains a mystery, so an Indian research group went to sea last year to gather clues.
One way of describing Earth’s irregular shape, the geoid, is a hypothetical equipotential surface. That is, the geoid is what the shape of Earth’s surface would be if oceans covered the whole planet and if there were no winds and tides to ruffle the surface—just Earth’s rotation and the forces of gravity. Regional deviations of the geoid from an idealized hydrostatic ellipsoid, known as geoid anomalies, can be high geoid (positive) or low geoid (negative). Positive anomalies indicate a dense concentration of mass, like recently subducted oceanic slab. Negative anomalies indicate regions of less dense materials—a reservoir of hot magma, for example—beneath the surface. Extreme geoid anomalies are interesting because they imply a significant shift in the subsurface geodynamic conditions.
This expedition, the first of its kind, aims to unravel the source of this geoid anomaly—the largest in the world.
Geophysical studies over the past few decades have found an extremely low geoid anomaly in the Indian Ocean. This low-gravity region, which shows up as a 106-meter “dent” in the geoid, is referred to as the Indian Ocean Geoid Low (IOGL) [Sreejith et al., 2013; Ghosh et al., 2017]. Why is Earth’s mass in this region so low? The dominant hypotheses are based on seismological investigations [Čadek and Fleitout, 2006; Reiss et al., 2017] and viscoelastic modeling [Ghosh et al., 2017]. However, because of inherent methodological limitations and an almost complete lack of offshore seismological observations from this region, the mystery of this perplexing anomaly remains unsolved.
Last year, a research team at the National Centre for Polar and Ocean Research (NCPOR) in India led an extensive long-term deployment of broadband ocean bottom seismometers (OBSs) in the IOGL region. This expedition, the first of its kind, aims to unravel the source of this geoid anomaly—the largest in the world.

Hypotheses and Theories
The low-geoid estimates in the Indian Ocean span a vast area to the south of the Indian subcontinent. Mathematically speaking, these estimates are dominated by very long wavelength (>3,000 kilometers) anomaly components [Sreejith et al., 2013]. The most plausible explanation so far is that anomalous lower mantle convection, weakly coupled to shallow crustal plate motions, causes the large geoidal undulations [Chase, 1979].
Previous researchers have put forth several distinct theories underlying the IOGL’s existence. These include structural undulation in the core-mantle boundary [Negi et al., 1987], seismic low-velocity anomalies in the upper mantle [Rao and Kumar, 2014], and subducted slabs of oceanic origin that collected in a “slab graveyard” in the lower mantle during the Mesozoic era [Spasojevic et al., 2010; Simmons et al., 2015].
The IOGL could be a response to an extended mass anomaly with multiple sources.
Numerical modeling supported by global seismic tomography results provides new insight into the possible source and the mantle geodynamics beneath the Indian Ocean [Ghosh et al., 2017]. This model shows a low-density anomaly between the upper and middle mantle (~300–900 kilometers in depth) that migrates from an African deep mantle plume toward the northeast, driven by movement of the Indian tectonic plate.
Another view indirectly relates the geoid anomalies to intraplate deformation zones that are a surface manifestation of the mantle convection processes. These zones, which include the Central Indian Ocean Deformation Zone between the Indian and Australian plates, are associated with large-scale faults, folds, high heat flow, and seismic activity [Mishra, 2014]. Whether these intense deformation zones within the lithosphere really contribute to such a large-wavelength geoid anomaly is still under debate.
Considering these hypotheses and the broad nature of the anomaly, the IOGL could be a response to an extended mass anomaly with multiple sources. Therefore, local and regional seismic velocity models become critically important to highlight the multiple wavelength sources of this colossal geoid anomaly in the Indian Ocean.
Imaging Deep Structures Beneath the Indian Ocean
To understand and narrow down the gap between the dynamics of materials beneath the surface and its surface manifestation as the IOGL geoid anomaly, NCPOR started a large-scale seismological array deployment in the Indian Ocean. As a pilot project, in May 2018, NCPOR deployed 17 passive broadband OBSs. These sensors will record continuous time series data of seismic events for 1 year. The array extends laterally from the foci of the nearly circular IOGL anomaly to its southern extent (Figure 1).

The stations are spaced at distances of approximately 100 kilometers along the OBS profile. The OBS systems are equipped with four-component sensors (one in the vertical direction, two in the horizontal direction, and a hydrophone) and a digitizer with a dynamic range of –3 decibel points at 120 seconds, taking 100 samples per second.

Our Focus and Potential Applications
We hope to explain the key factors that make the Indian Ocean geoid anomaly different from the geoid anomalies in other parts of the world.
The prime objective of our experiment is to image the deep mantle structures and their relationship with the geoid low anomaly in the Indian Ocean. We hope to explain the key factors that make the Indian Ocean geoid anomaly different from the geoid anomalies in other parts of the world. Such findings would offer several types of opportunities to geoscientists researching deep-ocean mantle dynamics.
For example, the ancient Tethys Ocean began to close as the Indian continent separated from the African, Antarctic, and Australian continents during the Late Cretaceous to early Paleocene, leading to the opening of the Indian Ocean. Researchers believe that during this period, slabs of oceanic origin subducted into a slab graveyard in the lower mantle [Spasojevic et al., 2010], which possibly contributed to the IOGL. We hope that the seismological data from the OBSs in the Indian Ocean will be able to resolve the uncertainties associated with the hypothesis that the subducted Tethyan plate seized beneath the Indian plate.
We foresee that seismological data acquired during the deployment period of our project will not only benefit the researchers working in solid Earth science beneath the unexplored parts of oceanic plates but will also help to quantify deep-ocean wave dynamics. For example, one research group at the Institut de Physique du Globe de Paris in France is currently attempting to extract signals from seismic network data that could model ocean wave dynamics using a beam-forming approach.
The U.S. Geological Survey (USGS) Global Seismographic Network shows 290 earthquakes with magnitudes at or greater than 5.5 recorded between May and December 2018 within an arc distance of 20° to 120° from the center of the OBS array that we deployed in May 2018. We are using these earthquakes to model the theoretical ray paths between sources and stations. Modeling theoretical ray paths gives quite a good sense of the resolution we can expect using teleseismic earthquake data from this experiment (Figure 2). Local earthquakes are not common in the central Indian Ocean, but with the help of our OBS array, we might be able to look into the local seismicity around the IOGL region.

The seismological data retrieved from the IOGL experiment will be under a moratorium for 3 years. After that, it will be made available to the geoscience community and can be accessed on request through the portal of India’s National Centre for Seismology.

Acknowledgments
We thank the director of NCPOR, Goa, for his sustained support in the successful deployment of passive OBSs. The project is funded by the Ministry of Earth Science, government of India, through research grant MoES/P.O.(Seismo)8(11)-Geoid/2012 (dated 15 November 2013). For the locations of land-based seismometers, the authors thank the National Centre for Seismology, Delhi, and Indian Institute of Science Education and Research, Pune. We acknowledge USGS for providing global earthquake locations. The authors gratefully acknowledge all scientific, fieldwork, and logistical help provided by participants of the IOGL project.
References
Čadek, O., and L. Fleitout (2006), Effect of lateral viscosity variations in the core-mantle boundary region on predictions of the long-wavelength geoid, Stud. Geophys. Geod., 50, 217–232, https://doi.org/10.1007/s11200-006-0013-0.
Chase, C. G. (1979), Subduction, the geoid, and lower mantle convection, Nature, 282, 464–468, https://doi.org/10.1038/282464a0.
Ghosh, A., G. Thyagarajulu, and B. Steinberger (2017), The importance of upper mantle heterogeneity in generating the Indian Ocean Geoid Low, Geophys. Res. Lett., 44, 9,707–9,715, https://doi.org/10.1002/2017GL075392.
Mishra, D. C. (2014), Geoid low and highs of the Indian Ocean and western Pacific: Implications to mantle convection, J. Asian Earth Sci., 79, 441–445, https://doi.org/10.1016/j.jseaes.2013.10.020.
Negi, J. G., N. K. Thakur, and P. K. Agrawal (1987), Can depression of the core-mantle interface cause coincident Magsat and geoidal ‘lows’ of the central Indian Ocean?, Phys. Earth Planet. Inter., 45, 68–74, https://doi.org/10.1016/0031-9201(87)90198-1.
Rao, B. P., and M. R. Kumar (2014), Seismic evidence for slab graveyards atop the core mantle boundary beneath the Indian Ocean Geoid Low, Phys. Earth Planet. Inter., 236, 52–59, https://doi.org/10.1016/j.pepi.2014.08.005.
Reiss, A. S., et al. (2017), A hot midmantle anomaly in the area of the Indian Ocean Geoid Low, Geophys. Res. Lett., 44, 6,702–6,711, https://doi.org/10.1002/2017GL073440.
Simmons, N. A., et al. (2015), Evidence for long‐lived subduction of an ancient tectonic plate beneath the southern Indian Ocean, Geophys. Res. Lett., 42, 9,270–9,278, https://doi.org/10.1002/2015GL066237.
Spasojevic, S., M. Gurnis, and R. Sutherland (2010), Mantle upwellings above slab graveyards linked to the global geoid lows, Nat. Geosci., 3, 435–438, https://doi.org/10.1038/ngeo855.
Sreejith, K. M., et al. (2013), High-resolution residual geoid and gravity anomaly data of the northern Indian Ocean—An input to geological understanding, J. Asian Earth Sci., 62, 616–626, https://doi.org/10.1016/j.jseaes.2012.11.010.
Author Information
Lachit S. Ningthoujam ([email protected]), Sanjay S. Negi, and Dhananjai K. Pandey, National Centre for Polar and Ocean Research, Goa, India
Citation:
Ningthoujam, L. S., S. S. Negi, and D. K. Pandey (2019), Seismologists search for the Indian Ocean’s “missing mass”, Eos, 100, https://doi.org/10.1029/2019EO120243. Published on 18 April 2019.
Text © 2019. The authors. CC BY 3.0
Except where otherwise noted, images are subject to copyright. Any reuse without express permission from the copyright owner is prohibited.