• About
  • Special Reports
  • Topics
    • Climate
    • Earth Science
    • Oceans
    • Space & Planets
    • Health & Ecosystems
    • Culture & Policy
    • Education & Careers
    • Opinions
  • Projects
    • Postcards From the Field
    • ENGAGE
    • Editors’ Highlights
    • Editors’ Vox
    • Eos en Español
    • Eos 简体中文版
    • Print Archive: 2015–2025
  • Policy Tracker
  • Blogs
    • Research & Developments
    • The Landslide Blog
  • Newsletter
  • Submit to Eos
  • AGU.org
  • Career Center
  • Join AGU
  • Give to AGU
  • About
  • Special Reports
  • Topics
    • Climate
    • Earth Science
    • Oceans
    • Space & Planets
    • Health & Ecosystems
    • Culture & Policy
    • Education & Careers
    • Opinions
  • Projects
    • Postcards From the Field
    • ENGAGE
    • Editors’ Highlights
    • Editors’ Vox
    • Eos en Español
    • Eos 简体中文版
    • Print Archive: 2015–2025
  • Policy Tracker
  • Blogs
    • Research & Developments
    • The Landslide Blog
  • Newsletter
  • Submit to Eos
Skip to content
  • AGU.org
  • Career Center
  • Join AGU
  • Give to AGU
Eos

Eos

Science News by AGU

Support Eos
Sign Up for Newsletter
  • About
  • Special Reports
  • Topics
    • Climate
    • Earth Science
    • Oceans
    • Space & Planets
    • Health & Ecosystems
    • Culture & Policy
    • Education & Careers
    • Opinions
  • Projects
    • Postcards From the Field
    • ENGAGE
    • Editors’ Highlights
    • Editors’ Vox
    • Eos en Español
    • Eos 简体中文版
    • Print Archive: 2015–2025
  • Policy Tracker
  • Blogs
    • Research & Developments
    • The Landslide Blog
  • Newsletter
  • Submit to Eos

everything atmospheric

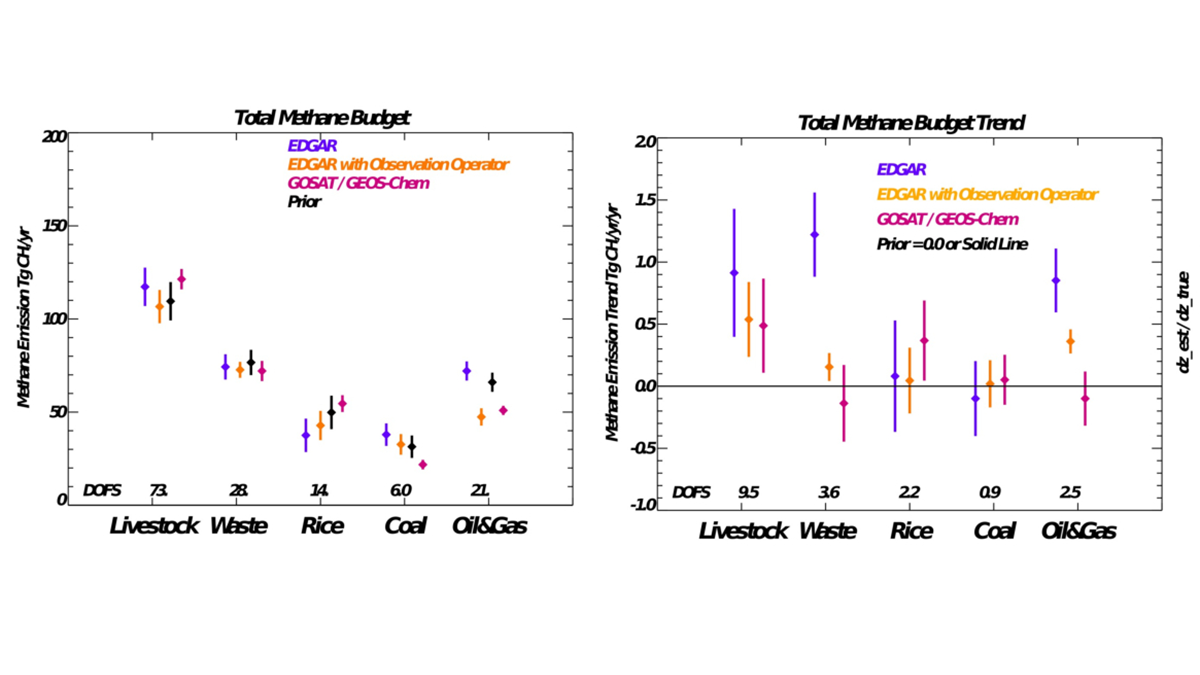
Two graphs from the paper.
Posted inEditors' Highlights

Using Bayesian Estimation to Improve Methane Inventories

by Donald Wuebbles 21 August 202315 September 2026

A Bayesian, optimal estimation evaluation of state-of-the-art methane inventory with satellite-based emissions from 2009 to 2018 finds substantial differences for livestock, rice, and coal emissions.

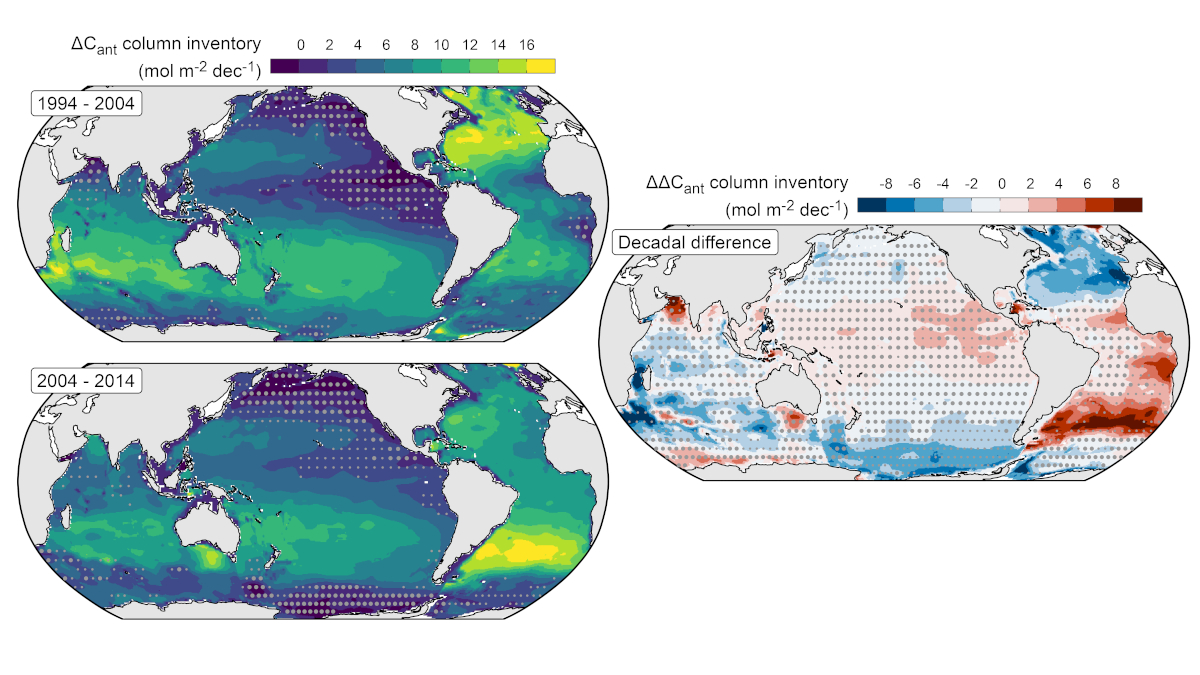
Three global maps using color to indicate different data.
Posted inEditors' Highlights

A Multidecadal View of Oceanic Storage of Anthropogenic Carbon

by Susan Trumbore 17 August 202315 August 2023

A decline in the ratio of ocean carbon accumulation to atmospheric carbon dioxide growth between 1994-2004 and 2004-2014 suggests a reduction in the sensitivity of the ocean carbon sink.

Photo of lightning striking trees.
Posted inEditors' Vox

Lightning-Caused Wildfires are 80 Percent More Likely Under Dry Vegetation

by Krishna Rao, Noah S. Diffenbaugh, Alexandra G. Konings, A. Park Williams, Marta Yebra and Colleen Bryant 2 August 20232 August 2023

Mimicking a randomized control trial of wildfires, scientists use satellites to uncover the key role of vegetation dryness in wildfire risk, aiding wildfire management and preparedness in California.
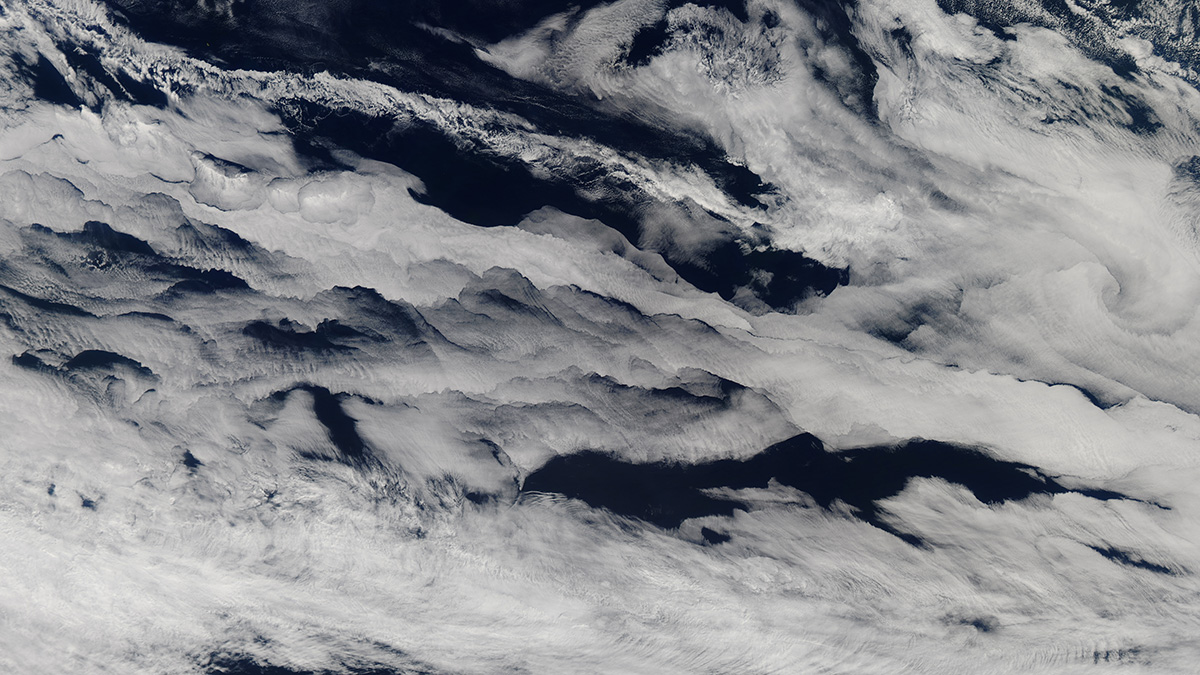
Satellite view of streaky stratocumulus clouds over the ocean
Posted inResearch Spotlights

Family Trees Clarify Relationships Among Climate Models

Sarah Stanley, Science Writer by Sarah Stanley 18 July 202318 July 2023

A new genealogy based on similarities in the computer codes of different climate models could improve studies that combine projections from multiple models.
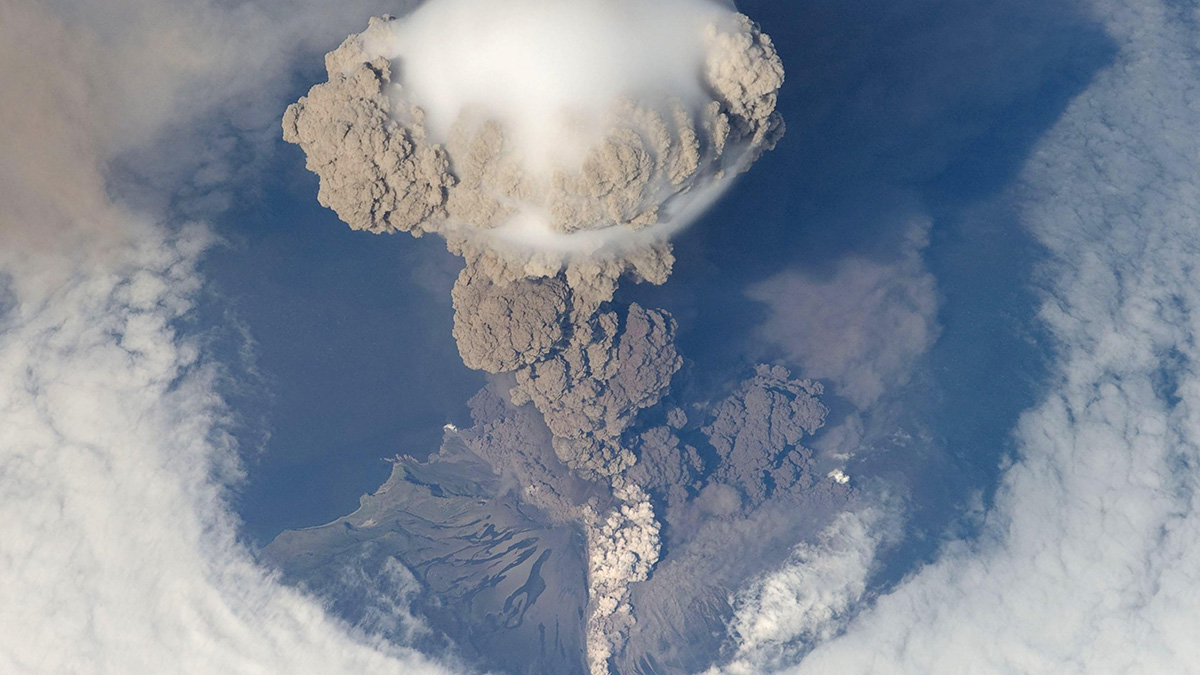
View from space of a massive ash and steam plume erupting from a volcano
Posted inResearch Spotlights

Volcanoes’ Future Climate Effects May Exceed Standard Estimates

Sarah Stanley, Science Writer by Sarah Stanley 29 June 202310 July 2023

Future releases of sulfur dioxide from volcanoes will likely be higher than the reconstructed historical levels currently used for climate predictions.
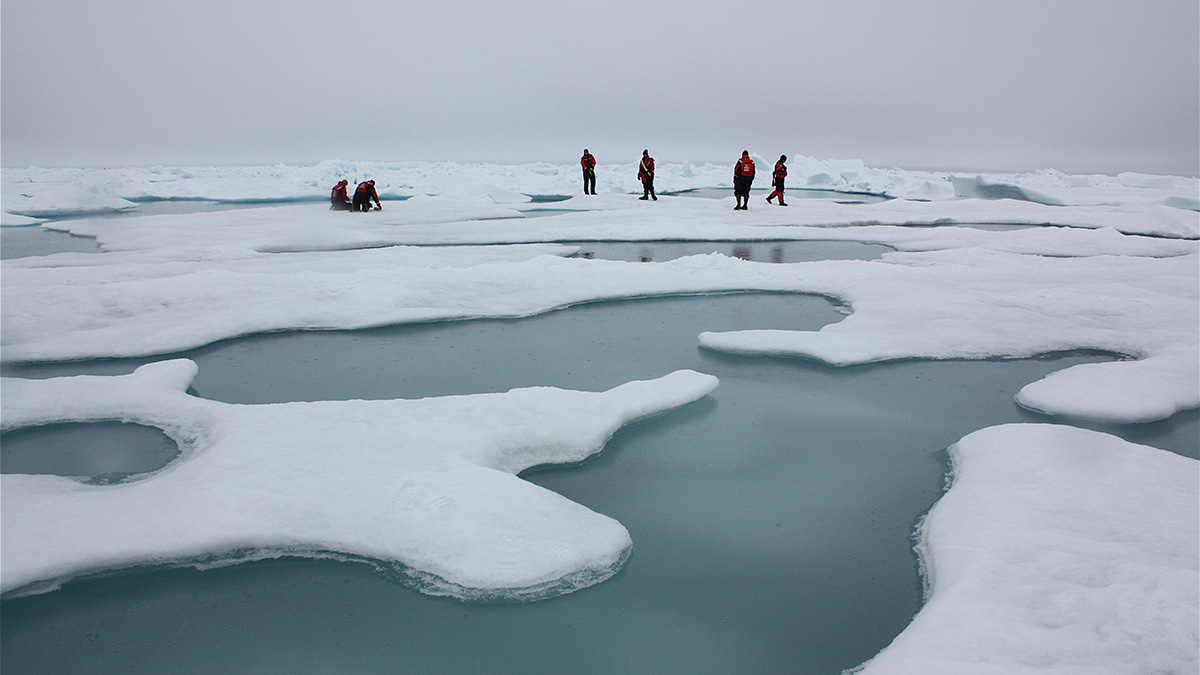
Researchers stand on a field of ice marked by spots of open water.
Posted inNews

Sea Ice Is Going, but When Will It Be Gone?

by Saima May Sidik 28 June 202328 June 2023

A pair of studies demonstrate the uncertainty over when the Arctic will become seasonally sea ice free.
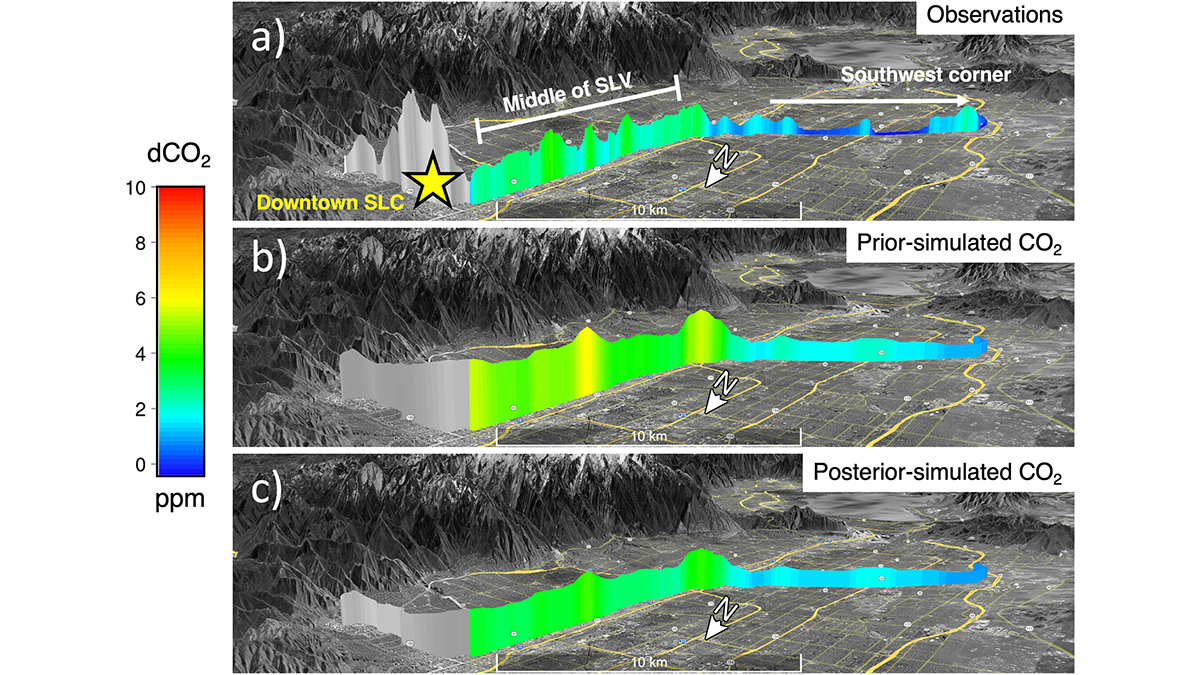
Diagram from the paper
Posted inEditors' Highlights

Tracking Human CO2 Emissions from Medium-Sized Cities

by Bo Zheng 28 June 202315 September 2026

Atmospheric inverse models, combined with observations, successfully tracked modest CO2 emission reductions in Salt Lake City during the first COVID-19 lockdown in 2020.
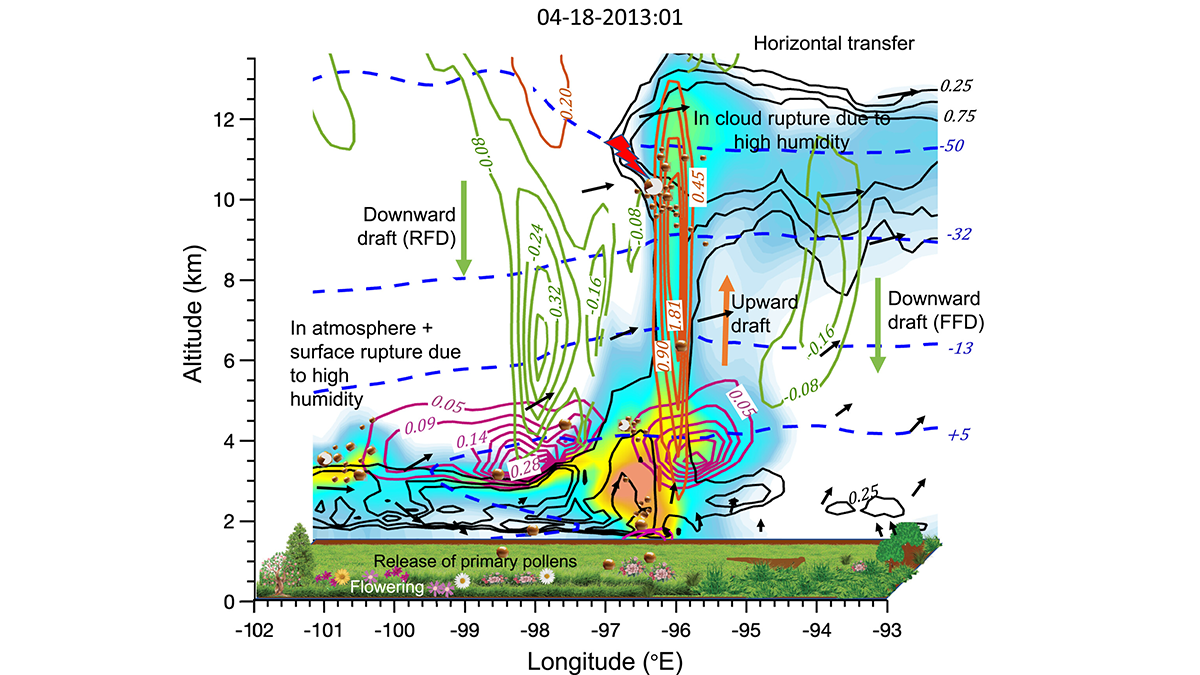
Diagram from the paper.
Posted inEditors' Highlights

Simulating the Journey of Pollen in the Atmosphere

by Jiwen Fan 19 June 202314 June 2023

A new study couples an emission and transport scheme of pollen from vegetation, and explores pollen’s evolution in different atmospheric conditions and its impacts on clouds and precipitation.

Roughly 20 people stand amid sand dunes under a clear blue sky and near a metal framework equipped with scientific instruments.
Posted inScience Updates

The Nitty-Gritty Forces That Shape Planetary Surfaces

by Brian Jackson, Serina Diniega, Timothy Titus, Alejandro Soto and Edgard Rivera-Valentin 15 June 202315 June 2023

Scientists are coming up with ingenious ways to compare terrestrial sand dunes, dust storms, and rain with their counterparts on Mars and Titan.
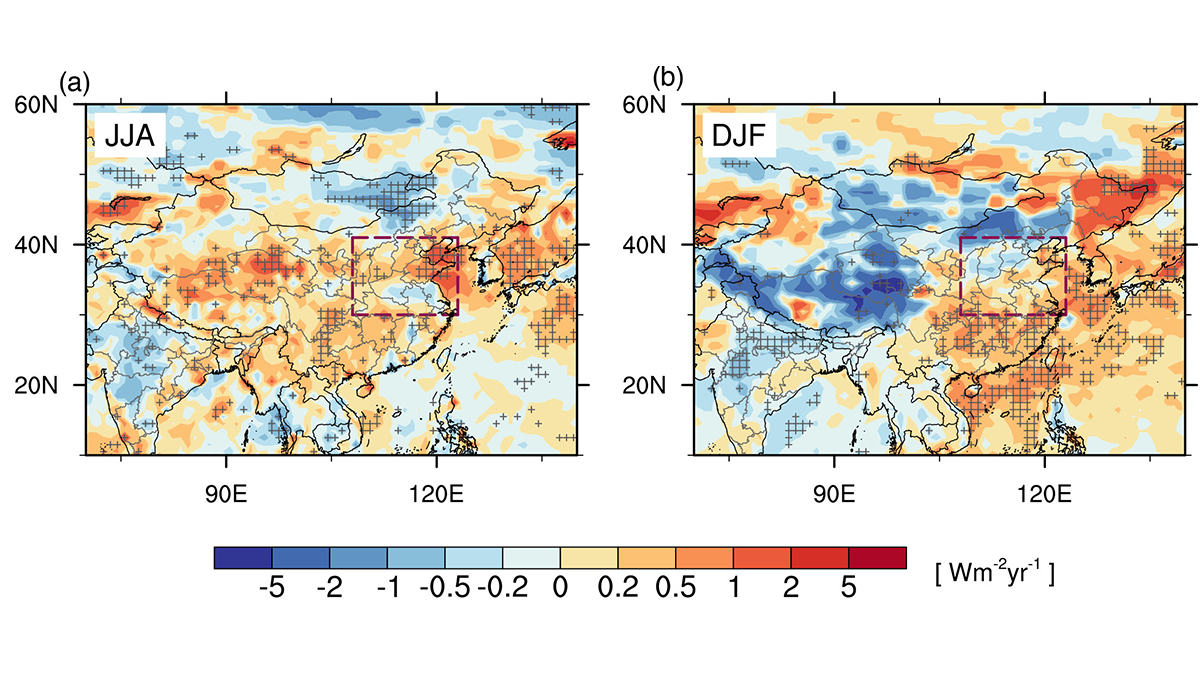
Two maps of the study area.
Posted inEditors' Highlights

A New Perspective on Aerosols and Emissions Over Northern China

by Ping Yang 15 June 202314 June 2023

During 2013-2019, a distinct seasonality for trends of aerosol concentrations and optical properties was found over Northern China.

Posts pagination

Newer posts 1 … 24 25 26 27 28 … 93 Older posts
Over a dark blue-green square appear the words Special Report: The State of the Science 1 Year On.

Features from AGU Publications

Research Spotlights

InSight into Seismology on the Red Planet

21 October 202621 October 2026
Editors' Highlights

The Geomagnetic Polarity Time Scale Revisited Once Again

22 October 202622 October 2026
Editors' Vox

Opening Access to Earth Observation Data for Disaster Mitigation

21 October 202620 October 2026
Eos logo at left; AGU logo at right

About Eos
ENGAGE
Awards
Contact

Advertise
Submit
Career Center
Sitemap

© 2026 American Geophysical Union. All rights reserved Powered by Newspack