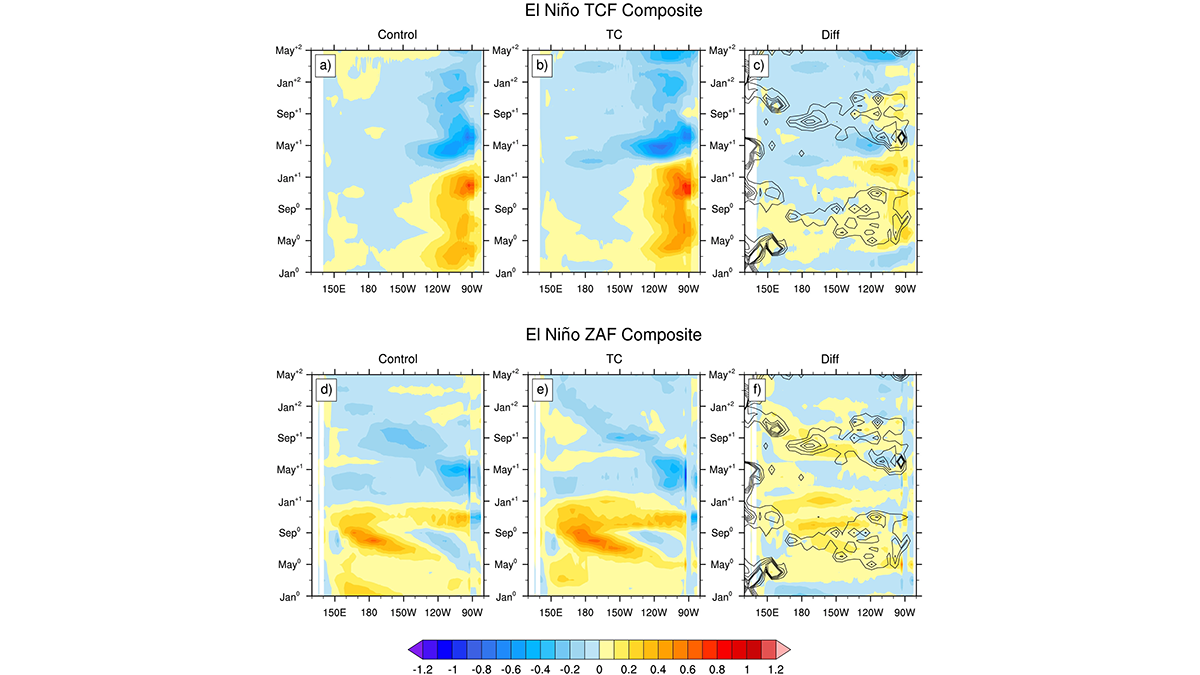
A suite of Earth Systems model experiments is used to explore how tropical cyclones influence the frequency, magnitude, and timing of El Niño-Southern Oscillation events.
everything atmospheric

Posted inEditors' Highlights
Taking Cloud Microphysics Experiments to the Next Level
Experiments in a cloud chamber have provided valuable insights into microphysical processes and will get more realistic as the height of the chamber increases.

Posted inResearch Spotlights
Tree Ring Width Predicted by Machine Learning
When predicting a tree’s annual growth, consider the whole weather system and not just the sum of its parts.
Posted inEditors' Highlights
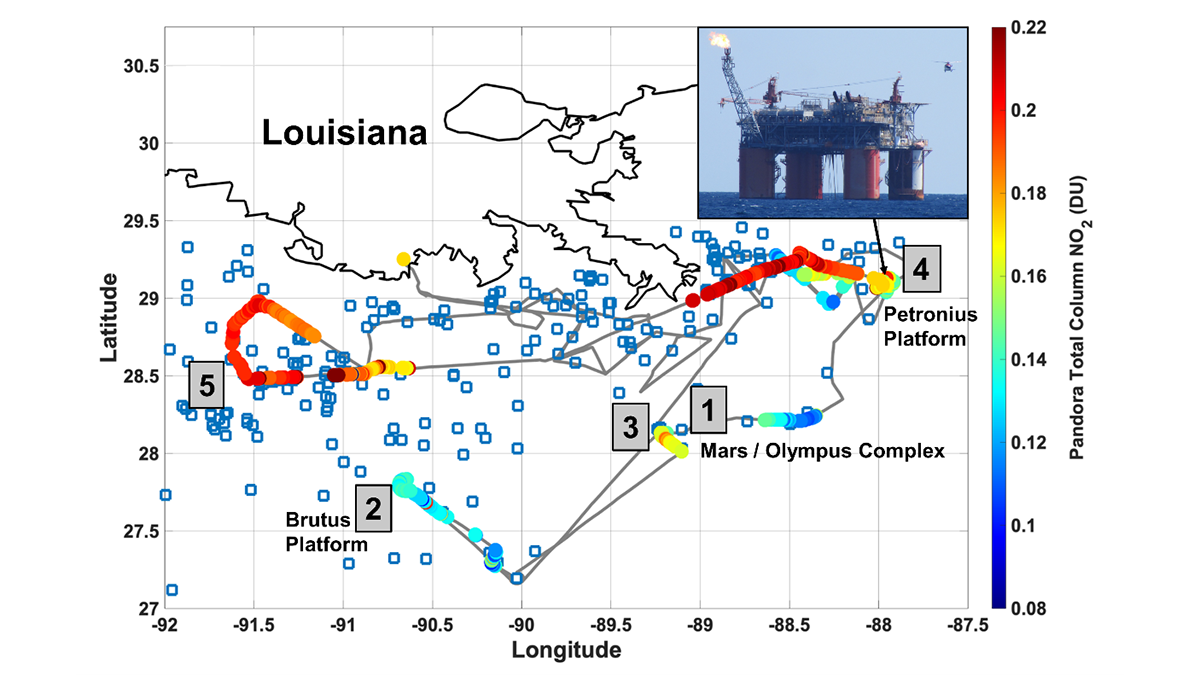
Remote Sensors See NO2 ‘Hot Spots’ from Offshore Oil Activity
Satellites can see NO2 pollution from space, but can they detect individual oil and natural gas operations, and are the measurements accurate?

Posted inNews
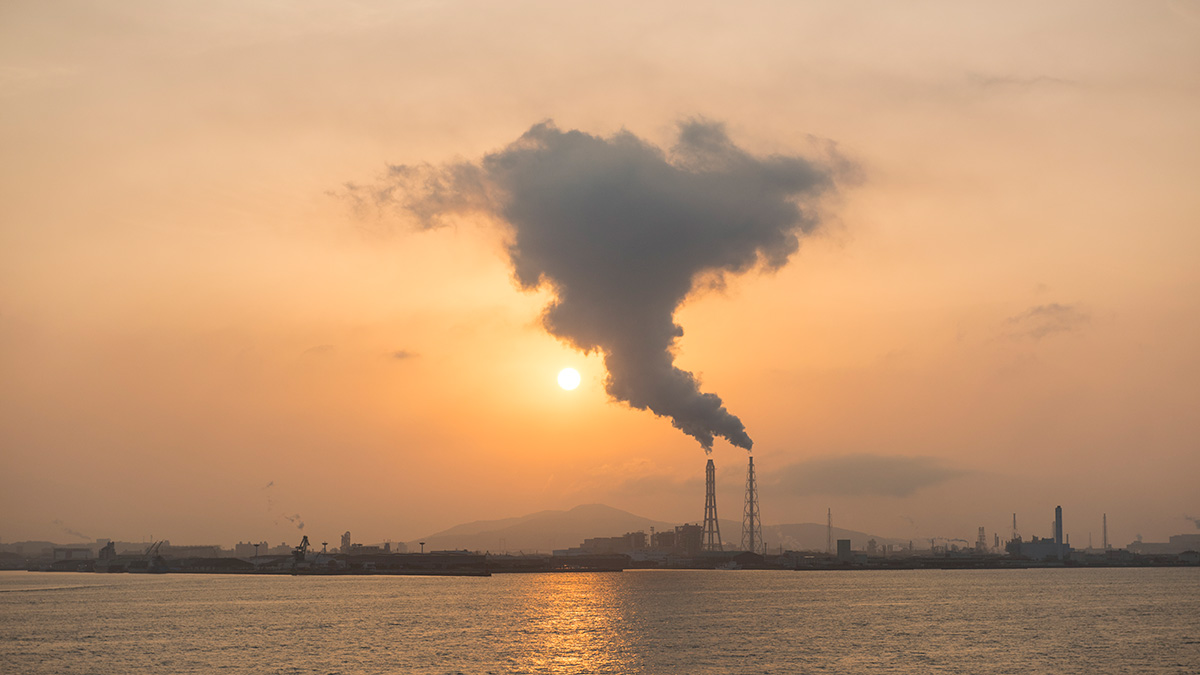
Climate Models Aren’t Dusty Enough
Mineral dust aloft in the atmosphere has a cooling effect not accounted for in current climate models.

Posted inENGAGE, News
“Revolutionary” Instrument to Watch North American Skies
TEMPO, scheduled for launch this April, will monitor ozone and other pollutants during hourly daytime scans, providing data for better air quality forecasts and atmospheric models.
Posted inEditors' Highlights
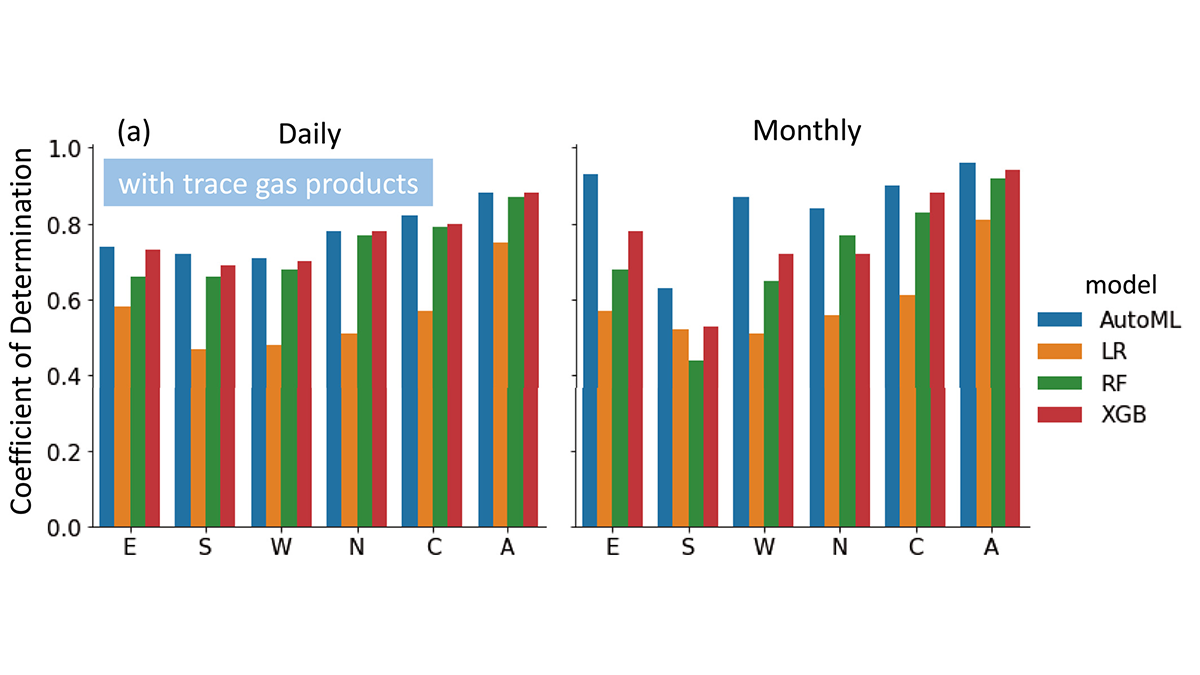
Unleashing the Power of AutoML for Atmospheric Research
Automated Machine Learning liberates domain scientists from selecting learners and hyperparameters and discovers the importance of atmospheric trace gases for improving surface PM2.5 estimates.

Posted inNews
Tonga Eruption May Temporarily Push Earth Closer to 1.5°C of Warming
The underwater eruption of Hunga Tonga–Hunga Ha‘apai sent megatons of water vapor into the stratosphere, contributing to an increase in global warming over the next 5 years.
Posted inResearch Spotlights
El dióxido de carbono antropogénico es rastreado hacia el océano
Con ayuda de un modelo de circulación oceánica, un equipo de investigadores logró etiquetar y rastrear el carbono emitido antropogénicamente para determinar si su destino es la atmósfera o el océano.

Posted inEditors' Highlights
Better Resolution Might Unlock the Mystery of Storms
Climate models have many persistent and systematic biases, but a new study shows that allowing for a physical rather than statistical representation of energy transport reduces one of them.