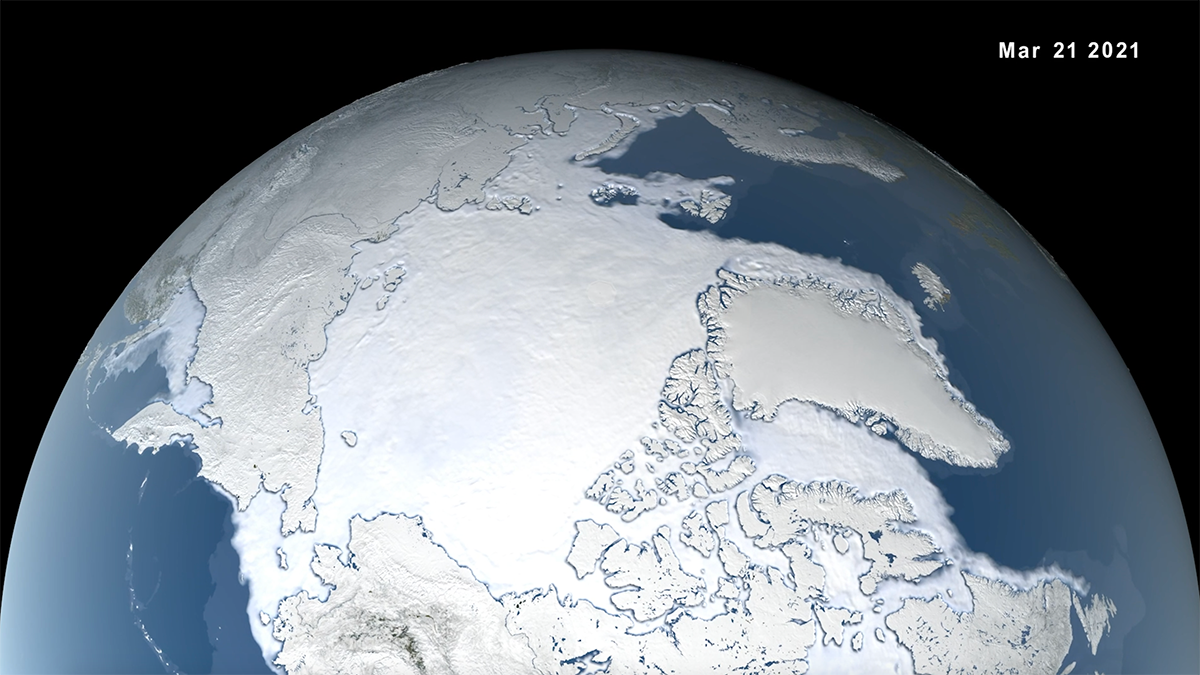
Climate change is increasing the frequency of moisture-dumping atmospheric rivers in the Arctic. The storms are pushing back sea ice at a time of year when it should be expanding.
everything atmospheric

Posted inNews
Extreme Wildfires Make Their Own Weather
Extreme fires in the western United States and Southeast Asia influenced the local weather in ways that make fires and smoke pollution worse.
Posted inEditors' Highlights
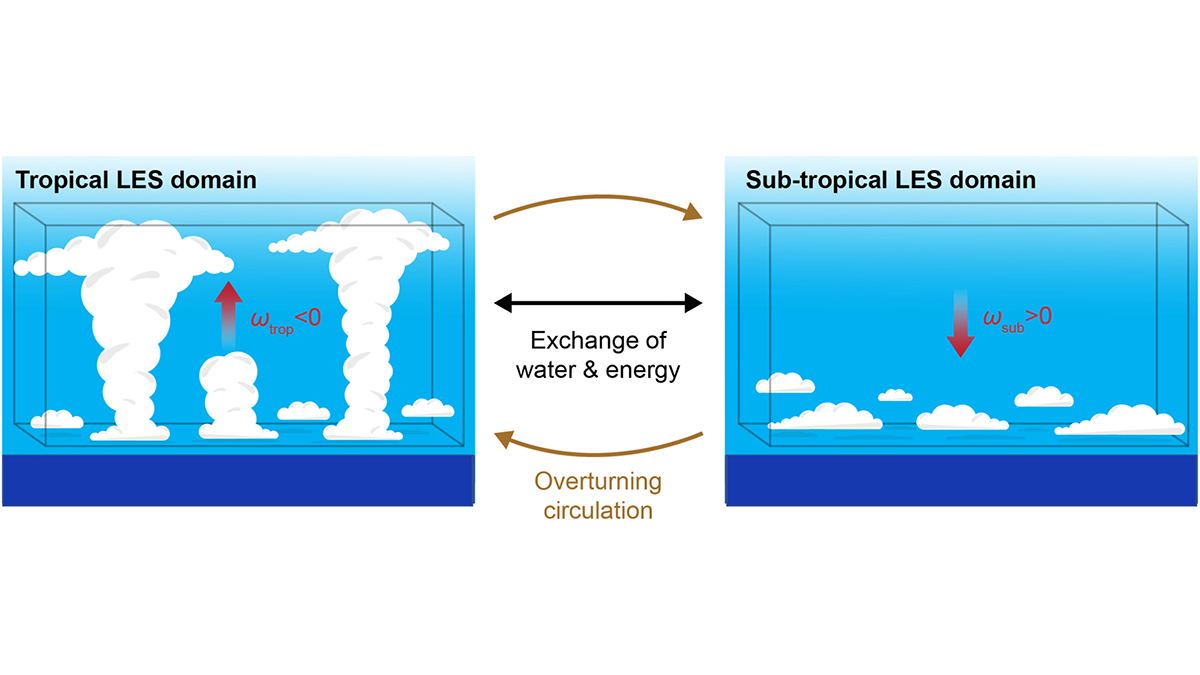
Examining Aerosol-Cloud-Climate Interactions at a Large Scale
A new numerical setup demonstrates that aerosols could affect clouds, and hence the radiation budget, thousands of kilometers from their location.

Posted inEditors' Highlights
Landfall Temperature of Atmospheric Rivers on the US West Coast
Atmospheric rivers that start in warm areas of the North Pacific generally stay warm, leading to warmer landfall temperatures in the western United States.
Posted inEditors' Highlights
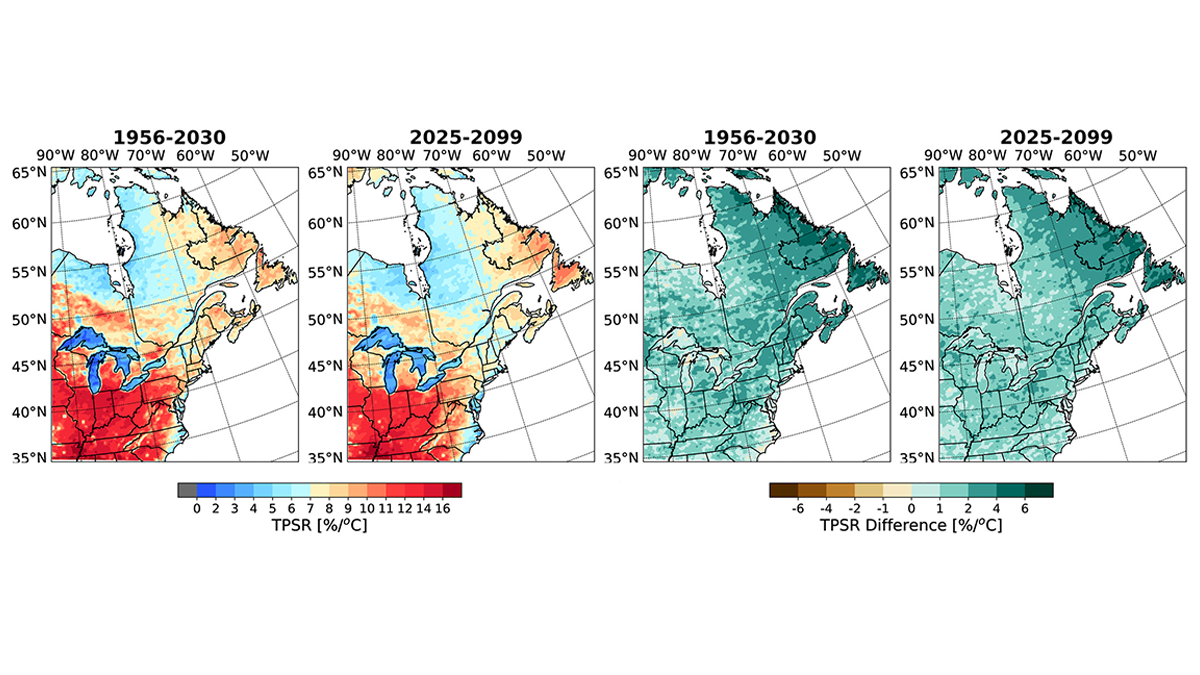
Rate of Temperature–Precipitation Scaling in Rainfall Events
Future extreme rain will be embedded in shorter, more convective dominant rainfall events in the northeastern region of North America, leading to larger rate in future temperature-precipitation scaling.
Posted inFeatures
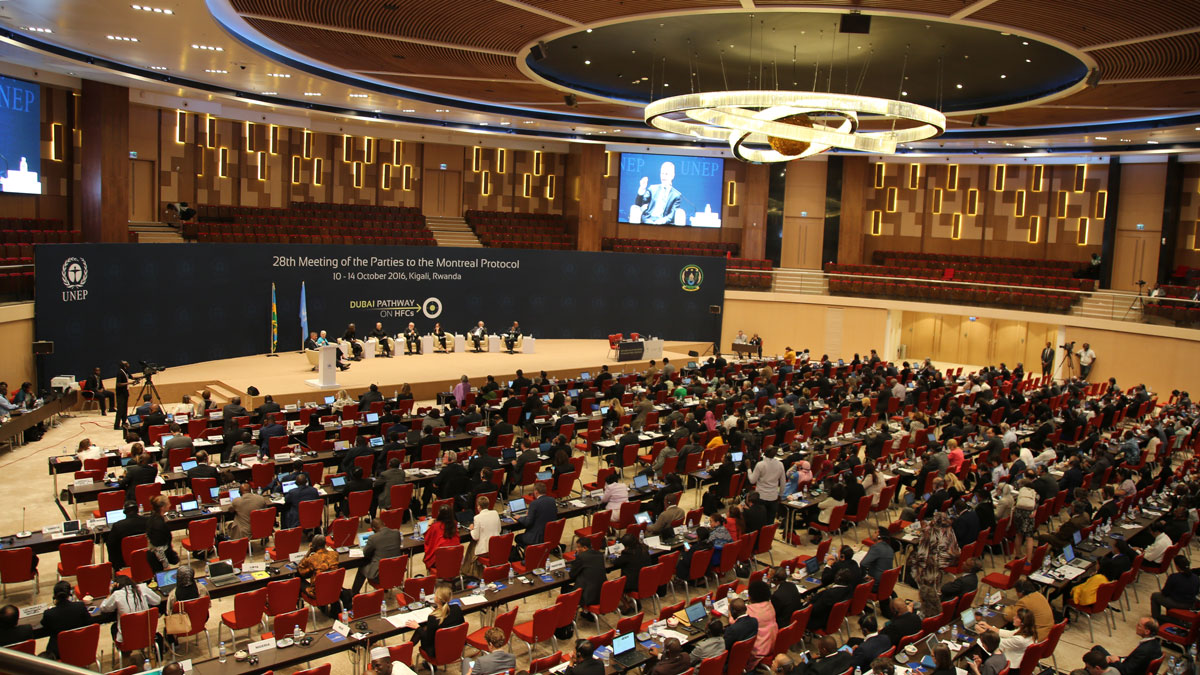
Estableciendo el marco para la acción climática bajo el Protocolo de Montreal
Doce artículos fueron la base científica para la rápida acción que reforzó el tratado, el cual ya estaba salvaguardando el ozono estratosférico, para que también protegiera el clima al reducir los super contaminantes.
Posted inEditors' Highlights
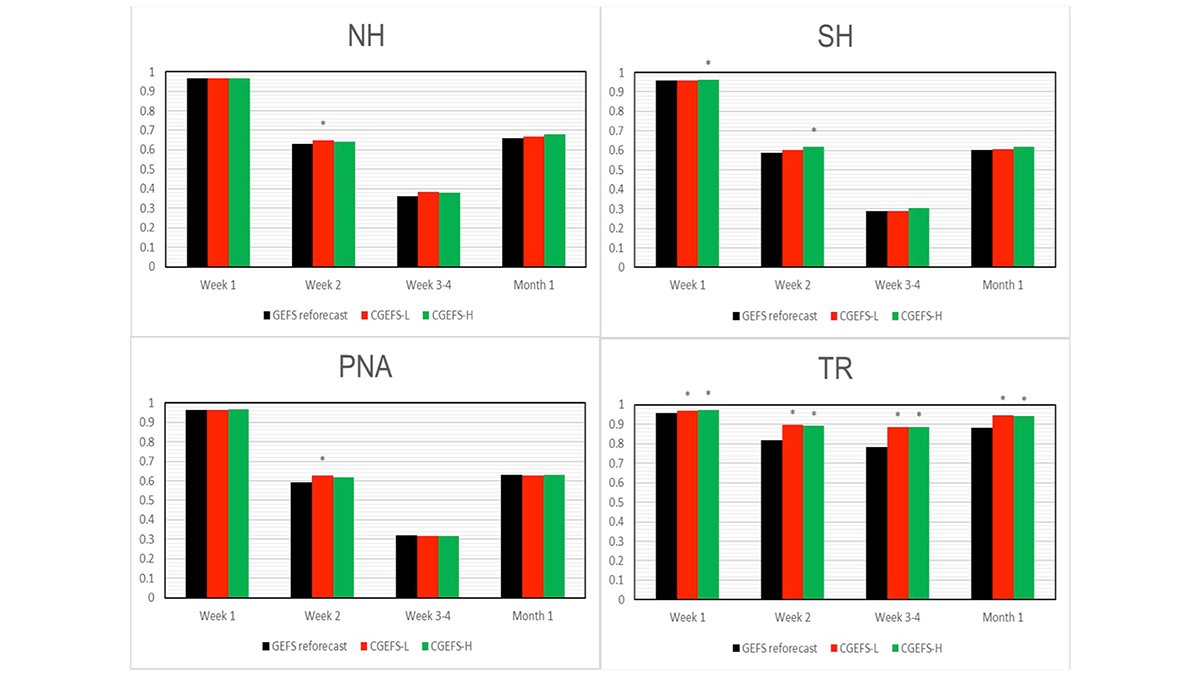
A New Coupled Modeling System Improves Forecast Skills
Building on older versions, the new Global Ensemble Forecast System with coupled atmosphere-land-ocean-ice-wave models has better forecasting skills of the atmosphere than the uncoupled system.

Posted inScience Updates
How Hail Hazards Are Changing Around the Mediterranean
A new method for studying hailstorms from space offers more consistent and more complete views of how and where hail forms, and how climate change might influence hail’s impacts in the future.

Posted inNews
How to Bend Lightning with a Laser Beam
For the first time, scientists have redirected lightning using a laser beam. And that’s just the start of what’s possible.
Posted inEditors' Highlights
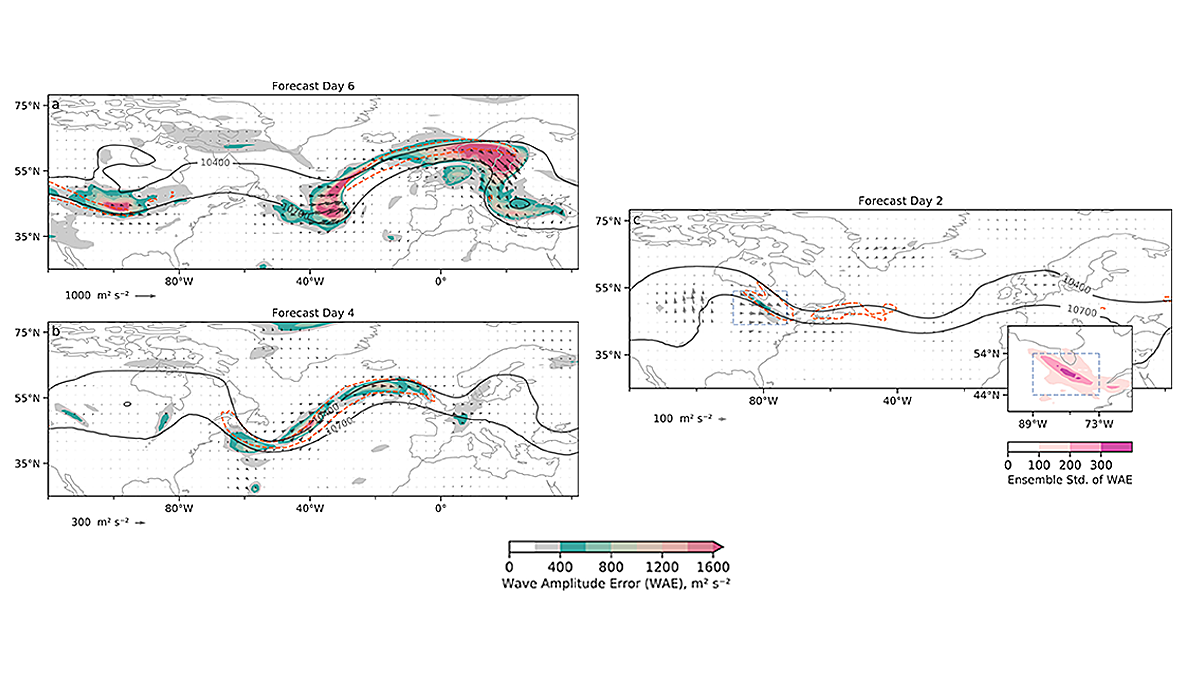
Mesoscale Convective Systems Impact Synoptic Wave Forecast
Scientists provide a process-level understanding of how mesoscale convective systems modify the evolution of the large-scale Rossby wave packet downstream and the jet stream.