
Dust lifted into the air by cyclones provides anchor points for cloud-forming ice.
Journal of Geophysical Research: Atmospheres

Posted inEditors' Highlights
Landfall Temperature of Atmospheric Rivers on the US West Coast
Atmospheric rivers that start in warm areas of the North Pacific generally stay warm, leading to warmer landfall temperatures in the western United States.
Posted inEditors' Highlights
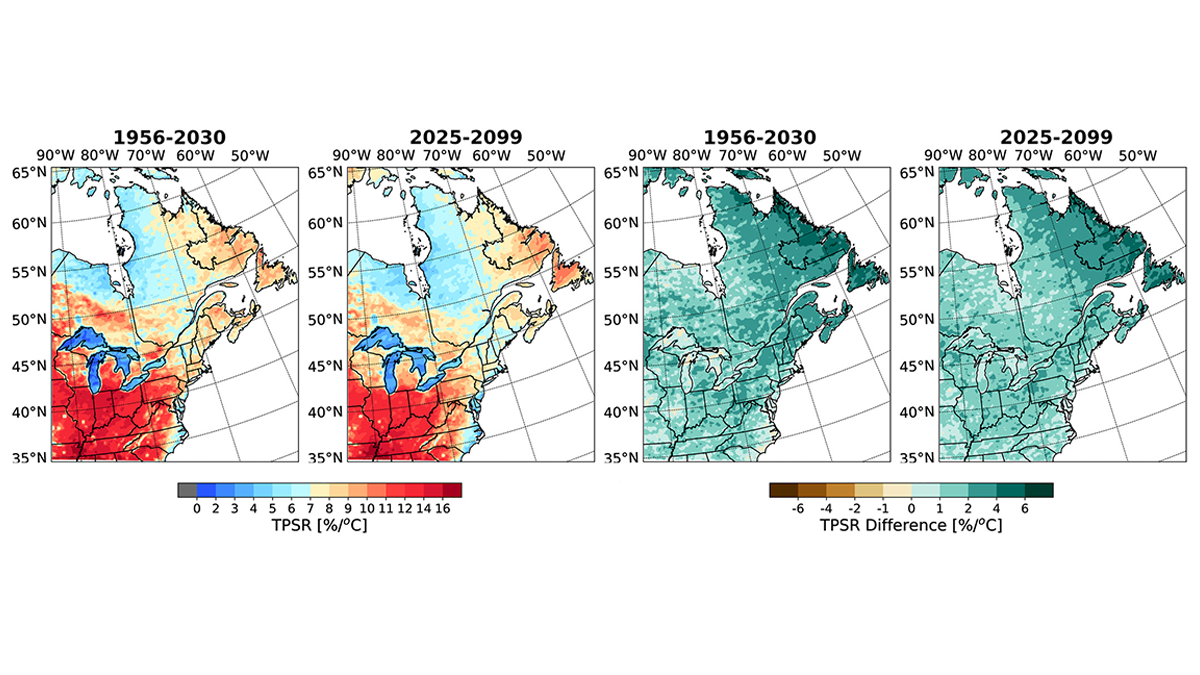
Rate of Temperature–Precipitation Scaling in Rainfall Events
Future extreme rain will be embedded in shorter, more convective dominant rainfall events in the northeastern region of North America, leading to larger rate in future temperature-precipitation scaling.
Posted inEditors' Highlights
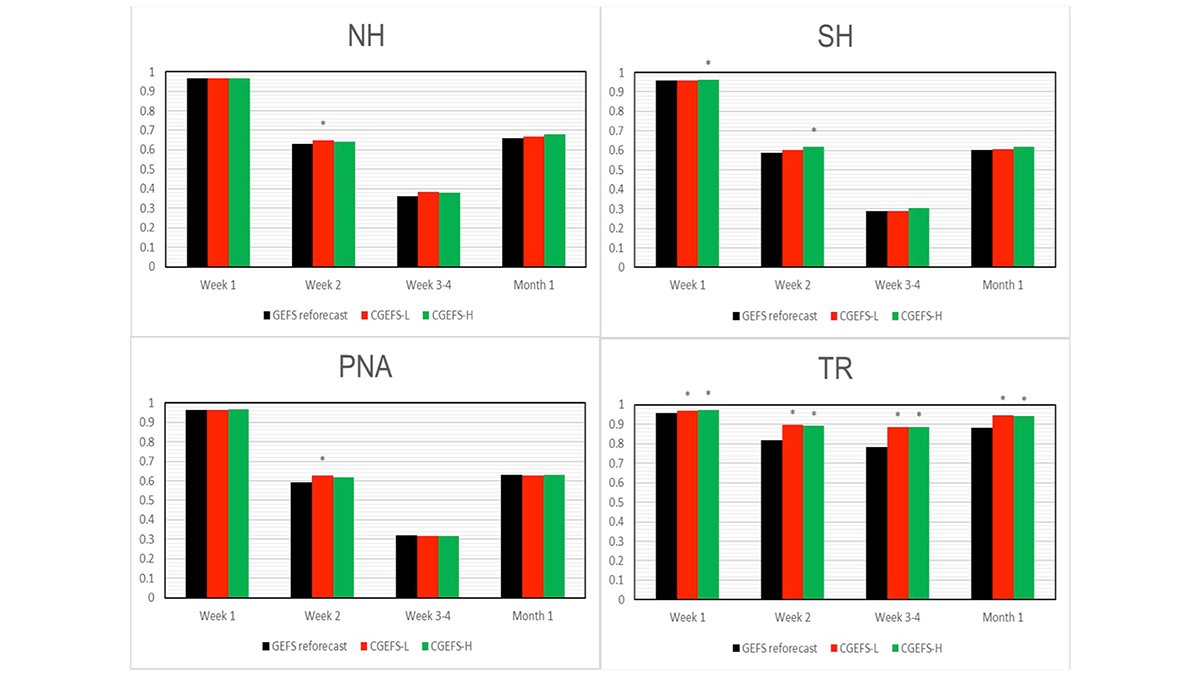
A New Coupled Modeling System Improves Forecast Skills
Building on older versions, the new Global Ensemble Forecast System with coupled atmosphere-land-ocean-ice-wave models has better forecasting skills of the atmosphere than the uncoupled system.
Posted inEditors' Highlights
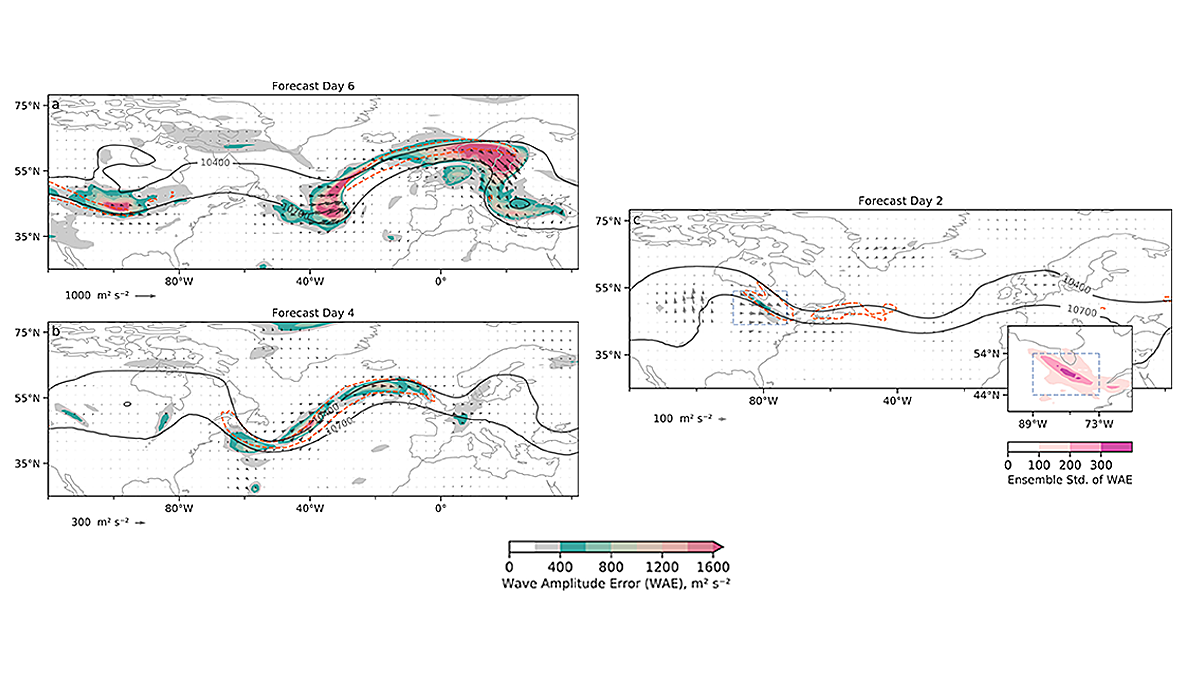
Mesoscale Convective Systems Impact Synoptic Wave Forecast
Scientists provide a process-level understanding of how mesoscale convective systems modify the evolution of the large-scale Rossby wave packet downstream and the jet stream.

Posted inResearch Spotlights
Scientists Can Now Map Lightning in 3D
A new approach enables meter-scale localization of lightning strikes. And it’s already illuminating the basic physics of the phenomenon.


Posted inResearch Spotlights
When the Aral Sea Dried Up, Central Asia Became Dustier
Winds kick up large amounts of dust from the desert that has formed as the world’s fourth largest lake has disappeared, spreading it around the region and raising concerns about public health.
Posted inEditors' Highlights
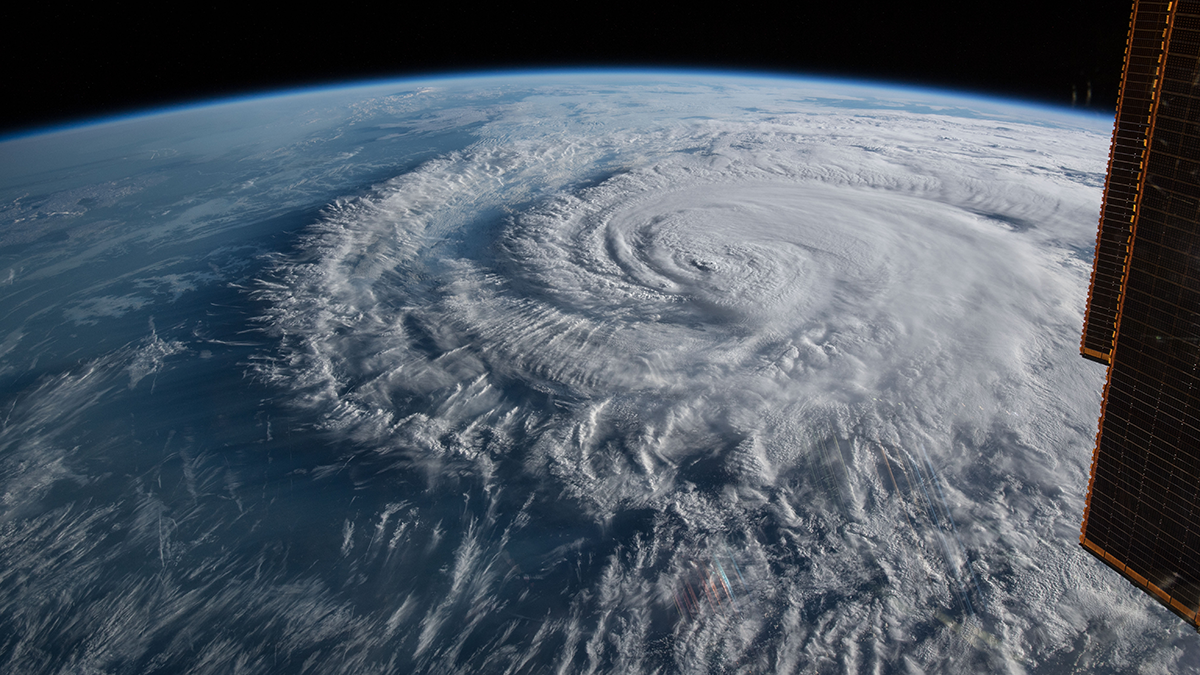
What is the Best Predictor of Landfalling Hurricane Damage?
A new study finds that the minimum sea level pressure, as another measure of hurricane strength, is a better predictor of hurricane damage in the United States than the maximum sustained wind speed.
Posted inEditors' Highlights
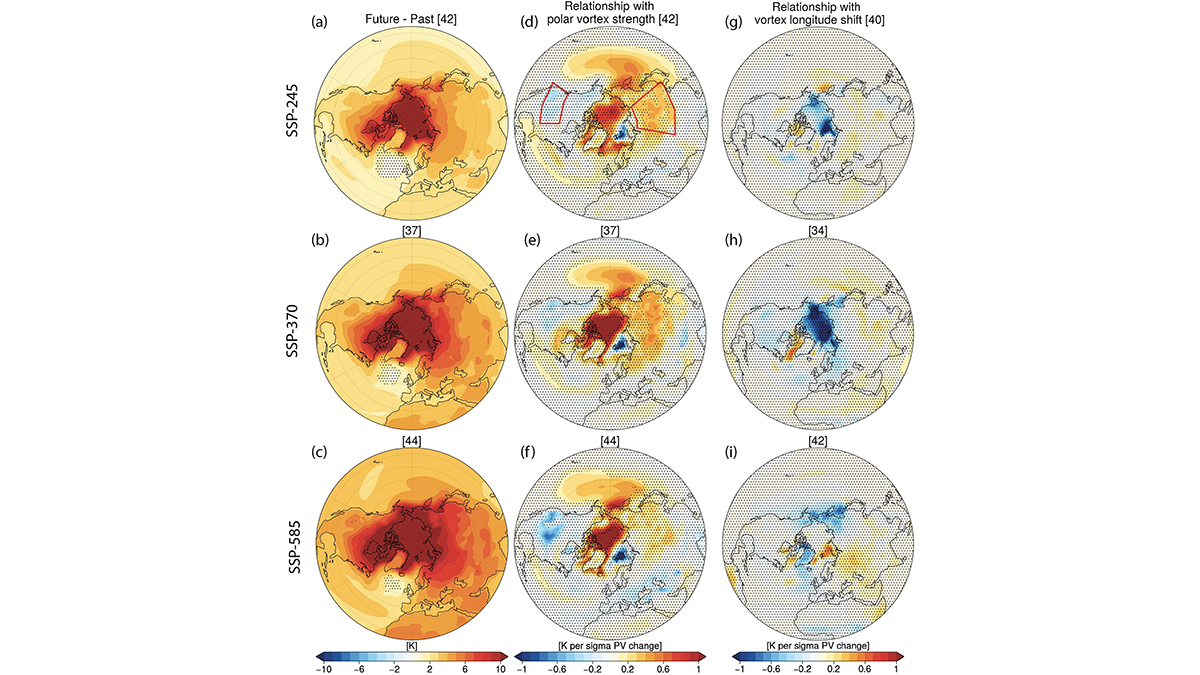
Modeling Stratosphere-Troposphere Coupling in a Changing Climate
Climate models have disagreed on the future evolution of the stratospheric polar vortex and links to the troposphere, but a new study revisits this problem with state-of-the-art climate models.