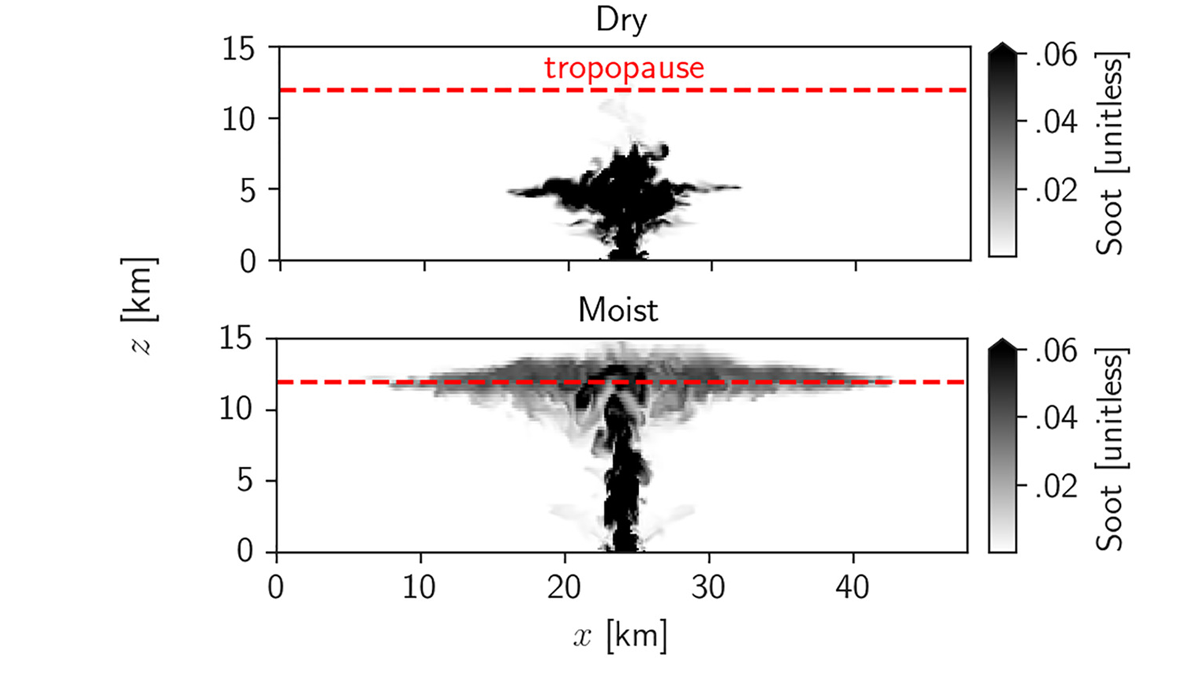
• About
  • Special Reports
  • Topics
    • Climate
    • Earth Science
    • Oceans
    • Space & Planets
    • Health & Ecosystems
    • Culture & Policy
    • Education & Careers
    • Opinions
  • Projects
    • Postcards From the Field
    • ENGAGE
    • Editors’ Highlights
    • Editors’ Vox
    • Eos en Español
    • Eos 简体中文版
    • Print Archive: 2015–2025
  • Policy Tracker
  • Blogs
    • Research & Developments
    • The Landslide Blog
  • Newsletter
  • Submit to Eos
  • AGU.org
  • Career Center
  • Join AGU
  • Give to AGU
  • About
  • Special Reports
  • Topics
    • Climate
    • Earth Science
    • Oceans
    • Space & Planets
    • Health & Ecosystems
    • Culture & Policy
    • Education & Careers
    • Opinions
  • Projects
    • Postcards From the Field
    • ENGAGE
    • Editors’ Highlights
    • Editors’ Vox
    • Eos en Español
    • Eos 简体中文版
    • Print Archive: 2015–2025
  • Policy Tracker
  • Blogs
    • Research & Developments
    • The Landslide Blog
  • Newsletter
  • Submit to Eos
Skip to content
  • AGU.org
  • Career Center
  • Join AGU
  • Give to AGU
Eos

Eos

Science News by AGU

Support Eos
Sign Up for Newsletter
  • About
  • Special Reports
  • Topics
    • Climate
    • Earth Science
    • Oceans
    • Space & Planets
    • Health & Ecosystems
    • Culture & Policy
    • Education & Careers
    • Opinions
  • Projects
    • Postcards From the Field
    • ENGAGE
    • Editors’ Highlights
    • Editors’ Vox
    • Eos en Español
    • Eos 简体中文版
    • Print Archive: 2015–2025
  • Policy Tracker
  • Blogs
    • Research & Developments
    • The Landslide Blog
  • Newsletter
  • Submit to Eos

Journal of Geophysical Research: Atmospheres

Visit the journal.

Images of ice particles
Posted inEditors' Highlights

New Cloud and Precipitation Data Over the Southern Ocean

by Minghua Zhang 11 October 202211 October 2022

New measurements show the macro- and microphysical characteristics of the clouds and precipitation over the data-space regions of the Southern Ocean.

Two maps showing surface temperature with different colors. The first map is for the period of 1871-1980 and the second is for the period of 1981-2010.
Posted inEditors' Highlights

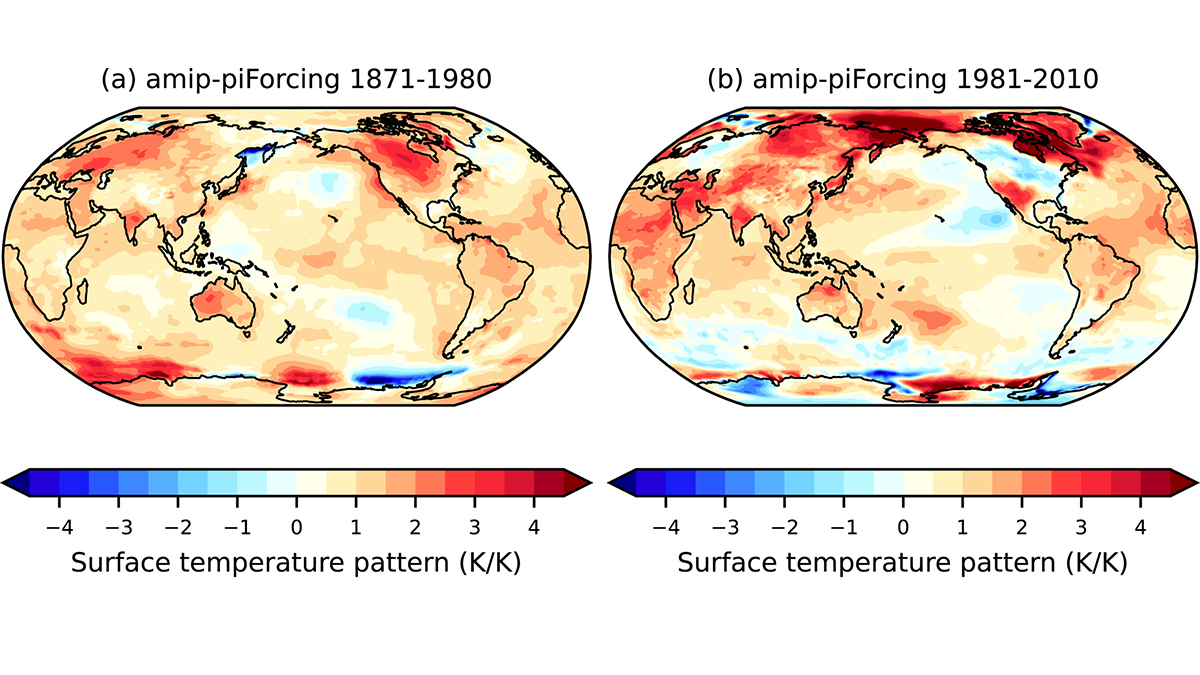
A Dilemma About Radiative Climate Feedback in Recent Decades

by Minghua Zhang 30 September 202228 September 2022

Given the unambiguous climate warming in recent decades, is it possible to infer radiative climate feedback from modern satellite measurements of the energy budget of the Earth?

Viburnum leaf beetle on a chewed leaf
Posted inResearch Spotlights

Plant-Nibbling Insects May Make It Cloudier and Cooler

by Rebecca Dzombak 17 August 202217 August 2022

Insects that eat plant leaves could change the local atmosphere, but current climate models do not account for this impact.

Four graphs showing the percent area covered by atmospheric rivers in the northern and southern hemispheres.
Posted inEditors' Highlights

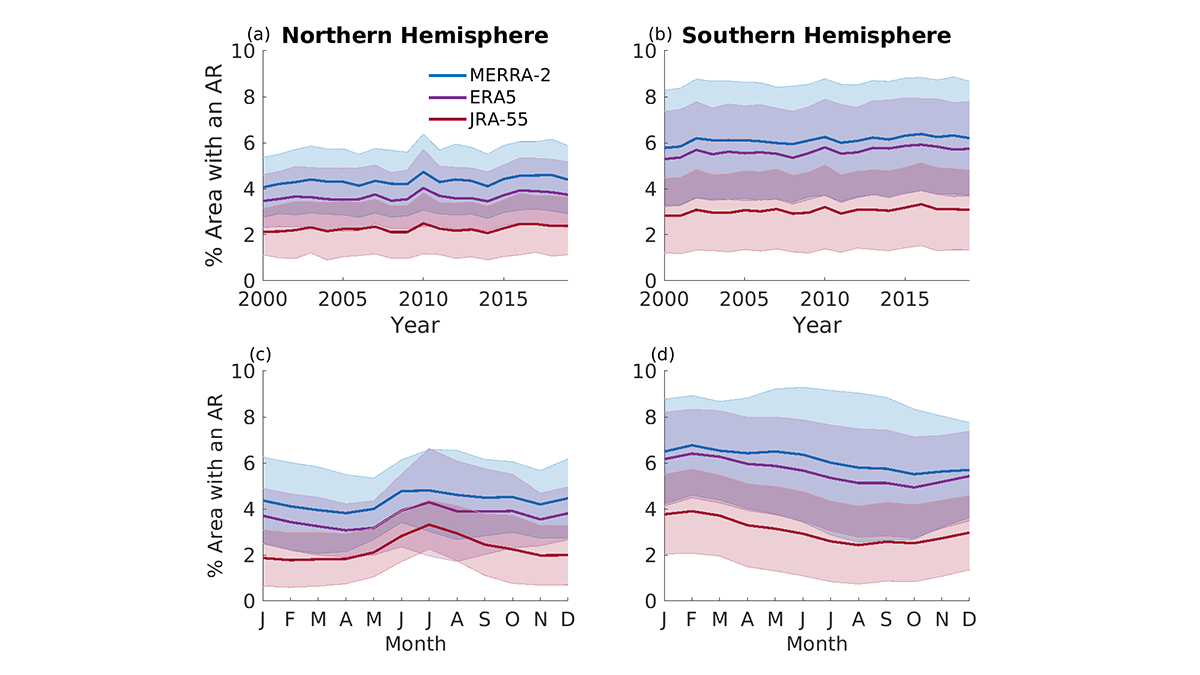
Comparing Methods for Analysis of Atmospheric Rivers

by Minghua Zhang 4 July 202230 January 2024

Results from the Atmospheric River Tracking Method Intercomparison Project (ARTMIP) describe the similarity and difference of using eleven detection algorithms and three reanalysis products.

Photo of S-band radar site with Mt. Aragats in the background.
Posted inEditors' Highlights

Radar Diagnosis of the Thundercloud Electron Accelerator

by Minghua Zhang 14 June 202210 March 2023

Altitude-resolved S-band radar observations of graupel are used to decipher thunderstorm ground enhancements in surface electric field and gamma ray flux.

Image showing composite polar vortex structure for disturbed conditions.
Posted inEditors' Highlights

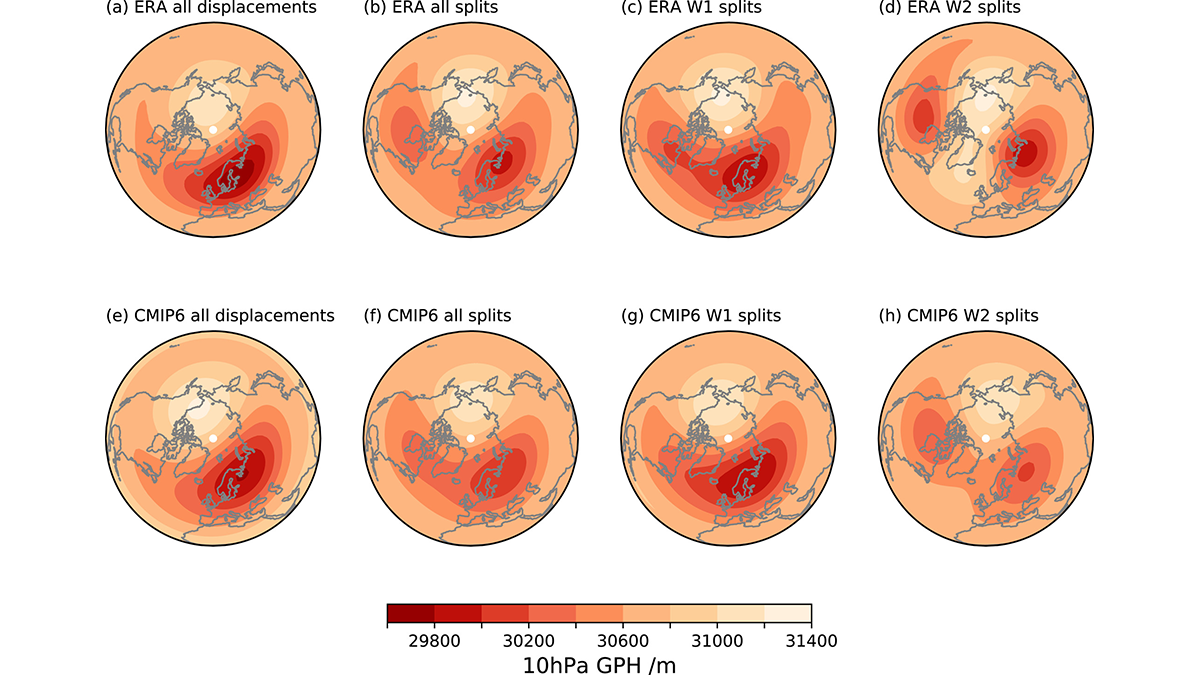
Simulating Surface Impacts of Stratospheric Sudden Warmings

by William J. Randel 10 June 202221 December 2022

New evaluations of climate model simulations show how the stratosphere polar vortex couples to surface weather.

Graph showing contribution of each large-scale atmospheric variable on the y-axis to predicted total convective area.
Posted inEditors' Highlights

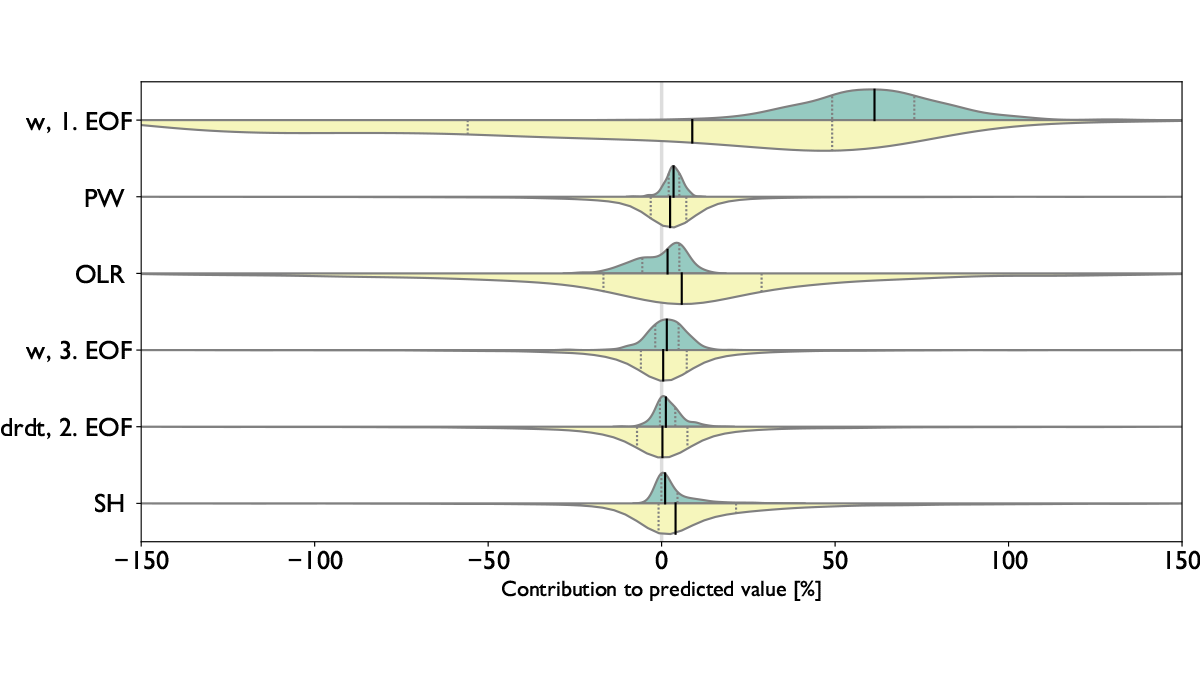
Using Artificial Intelligence to Study Convection

by Minghua Zhang 8 June 202223 January 2023

Machine learning techniques are used to examine relationships between the large-scale state of the atmosphere, the convection total area, and the degree of organization in northern Australia.

Diagrams showing cross correlation of cloud-feedback components in the multi-model ensemble.
Posted inEditors' Highlights

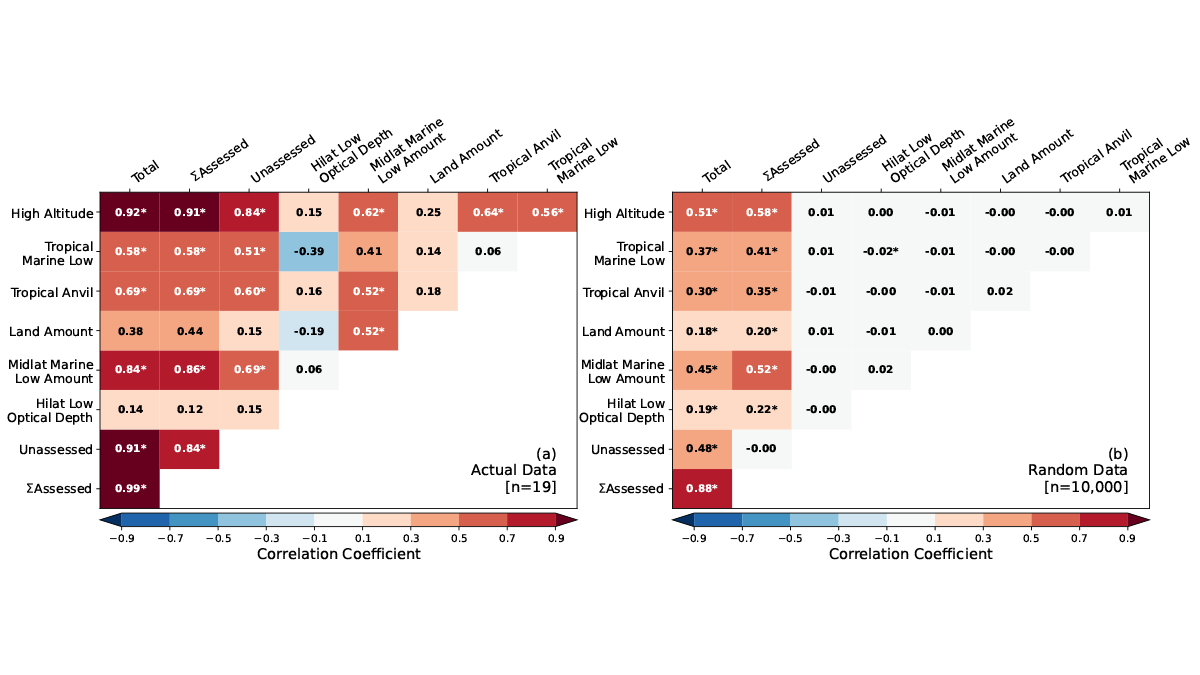
Cloud Feedbacks in CMIP6 Models Versus Expert Synthesis

by Minghua Zhang 6 June 202214 September 2022

Models with smallest feedback errors are found to have moderate cloud feedbacks and equilibrium climate sensitivity of 3 to 4 degrees of warming when the concentration of carbon dioxide is doubled.

Figures from the paper, showing simulated Ural blocking event.
Posted inEditors' Highlights

Arctic Sea Ice is Crucial for Forecasting Ural Blocking

by Yimin Liu 12 May 202221 December 2022

By solving the nonlinear optimization problem, sea ice concentration in Greenland, Barents and Okhotsk Seas is found crucial for prediction of strong and long-lasting Ural blocking formation.

Las partículas de carbono negro se esparcen por toda nuestra atmósfera, producidas por la quema de combustible o procesos industriales.
Posted inResearch Spotlights

¿Cuánto tiempo permanecen las partículas de carbono negro en la atmósfera?

Sarah Derouin, Science Writer by Sarah Derouin 8 March 202222 March 2022

Investigadores descubren cómo el carbono negro evoluciona de partículas hidrofóbicas a sitios de nucleación de nubes, removiendo eventualmente las partículas que absorben calor del cielo.

Posts pagination

Newer posts 1 … 3 4 5 6 7 … 20 Older posts
Over a dark blue-green square appear the words Special Report: The State of the Science 1 Year On.

Features from AGU Publications

Research Spotlights

How Wildfires Worsen Flood Risk

30 April 202630 April 2026
Editors' Highlights

Drivers of Day-to-Day Temperature Swings Across Continents

1 May 20261 May 2026
Editors' Vox

Hydrothermal Heat Flow as a Window into Subsurface Arc Magmas

28 April 20261 May 2026
Eos logo at left; AGU logo at right

About Eos
ENGAGE
Awards
Contact

Advertise
Submit
Career Center
Sitemap

© 2026 American Geophysical Union. All rights reserved Powered by Newspack