
Nuevos datos de exploración con aeronaves muestran que aunque la química atmosférica sobre regiones oceánicas remotas es una fuente considerable de producción de metanol, la emisión neta de metanol del océano es menor.
Journal of Geophysical Research: Atmospheres
Posted inEditors' Highlights
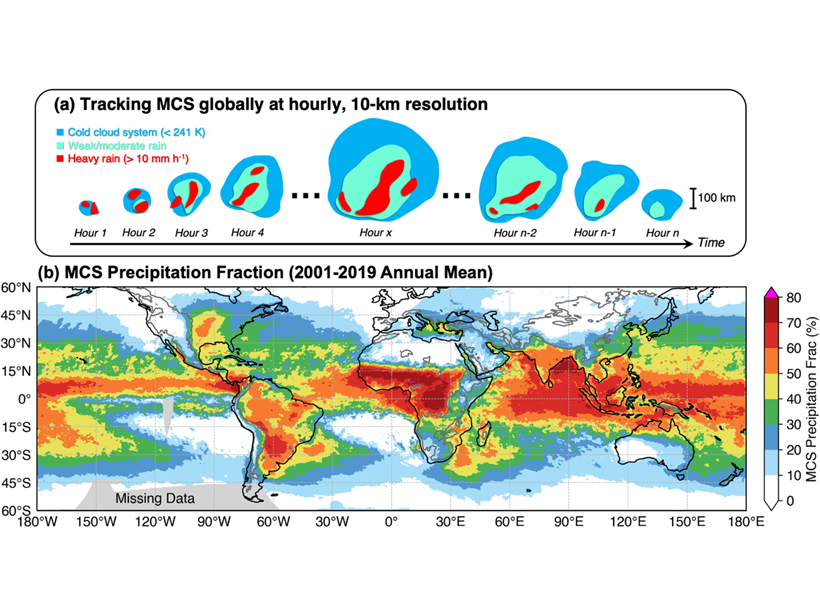
New Global Mesoscale Convective System Tracking Database
A 20-year high-resolution global mesoscale convective system tracking database reveals the characteristics of mesoscale convective systems and their significant contributions to global rainfall.


Posted inResearch Spotlights
Upward Lightning Takes Its Cue from Nearby Lightning Events
Lightning in a thunderstorm changes the electromagnetic field in a way that sparks upward lightning from tall structures.

Posted inResearch Spotlights
Improving the Global Budget for Atmospheric Methanol
New aircraft survey data show that although atmospheric chemistry above remote ocean regions is a considerable source of methanol production, the ocean’s net methanol emission is minor.
Posted inResearch Spotlights
Atmospheric Turbulence May Promote Cloud Droplet Formation
Turbulence causes local variations in relative humidity, which can push particles past a critical saturation threshold for droplet nucleation.

Posted inEditors' Highlights
New Land Surface Air Temperature Global Dataset
The fifth major update of land surface air temperature data from the Climatic Research Unit and the Met Office has extended the time series, included more stations, and used better processing methods.

Posted inEditors' Highlights
New Global Surface Temperature Dataset Spans 170 Years
HadCRUT5, the new version of the Met Office Hadley Centre/Climatic Research Unit global surface temperature dataset from 1850 to 2018, has extended and improved the previous temperature record.
Posted inResearch Spotlights
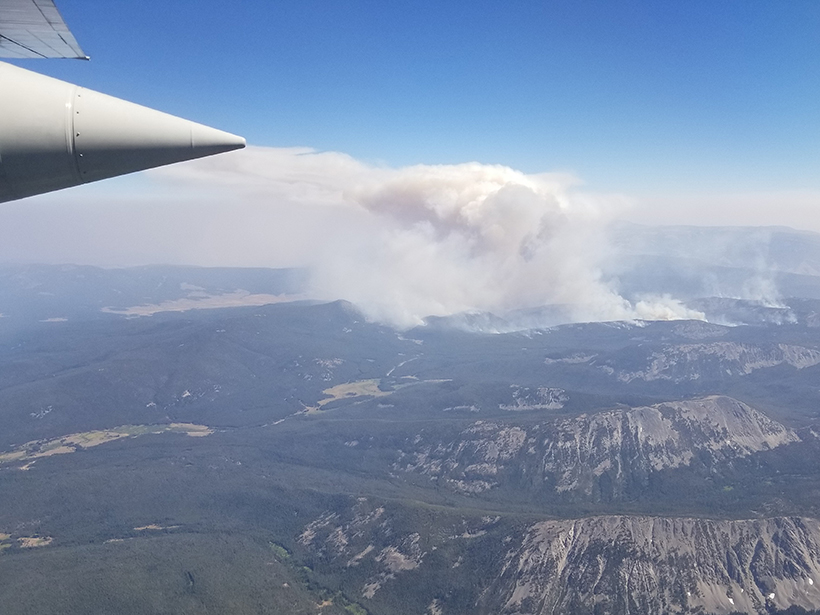
Seeding Ice Clouds with Wildfire Emissions
Wildfires create airborne plumes of organic and inorganic matter as they burn. These particles can nucleate cloud-forming ice crystals and affect cloud dynamics, precipitation, and climate.
Posted inEditors' Highlights
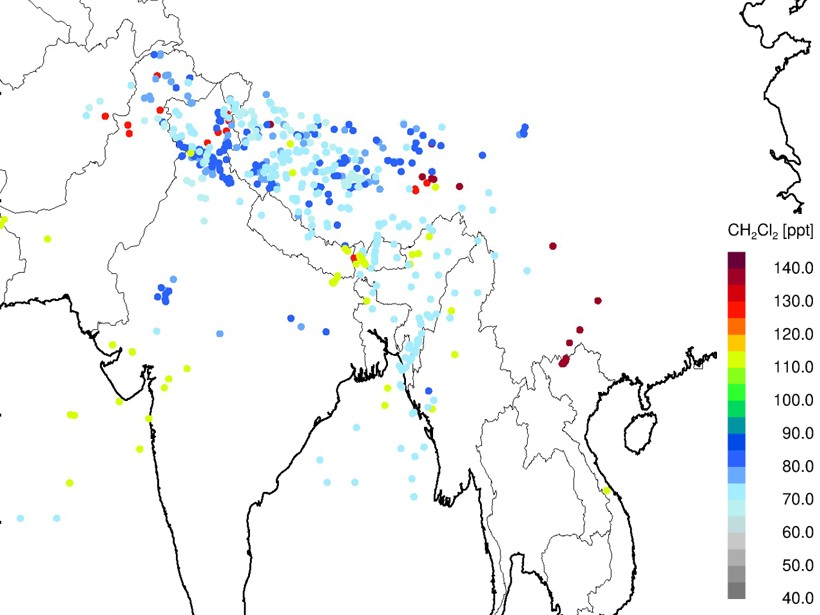
Measurements of Ozone-Depleting Chemicals in the Asian Monsoon
New high-altitude aircraft observations identify unexpected high levels of halogen-containing species entering the stratosphere above the summertime Asian monsoon.