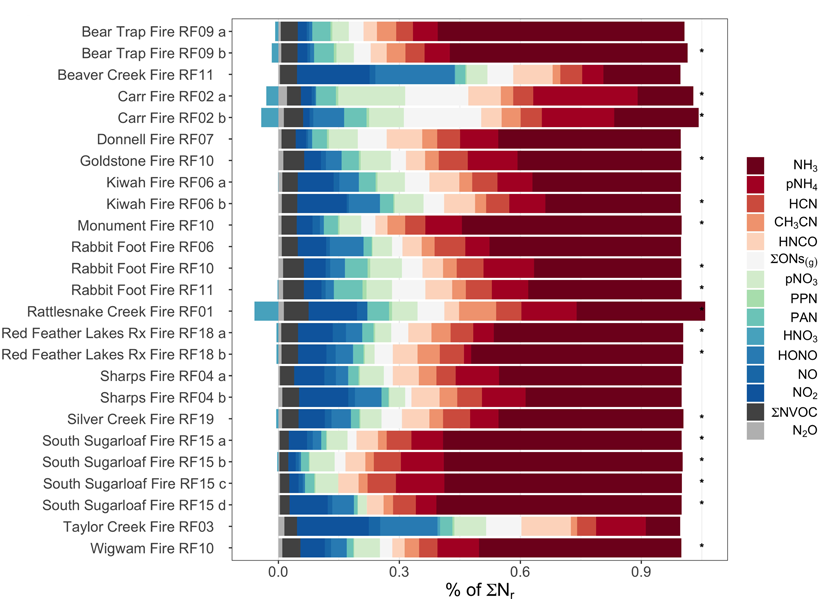
In-situ data gathered from an aircraft flying over 23 western US wildfires in 2018 reveal the importance of reduced nitrogen, shedding insights on ozone and aerosol formation from wildfires.
Journal of Geophysical Research: Atmospheres

Posted inEditors' Highlights
Devastation of Hurricane Maria to Puerto Rican Landscape
The destructive winds and rain of Hurricane Maria in 2017 caused a dramatic transformation to Puerto Rico’s landscape and altered the characteristics of land-air interaction.
Posted inEditors' Highlights
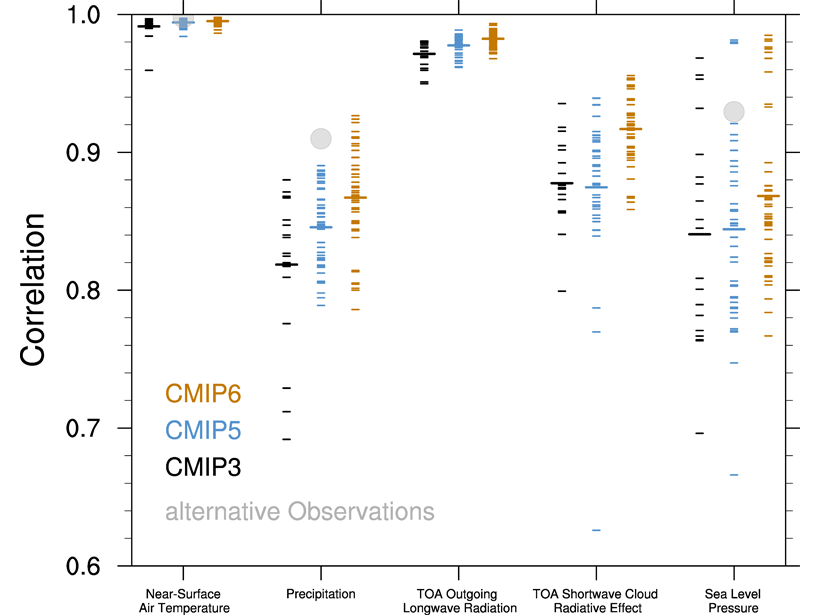
Climate Modeling Progress in the Past 15 Years
An assessment and comparison of the performances of climate models participating in three phases of the Coupled Model Intercomparison Project (CMIP3, CMIP5 and CMIP6).
Posted inResearch Spotlights
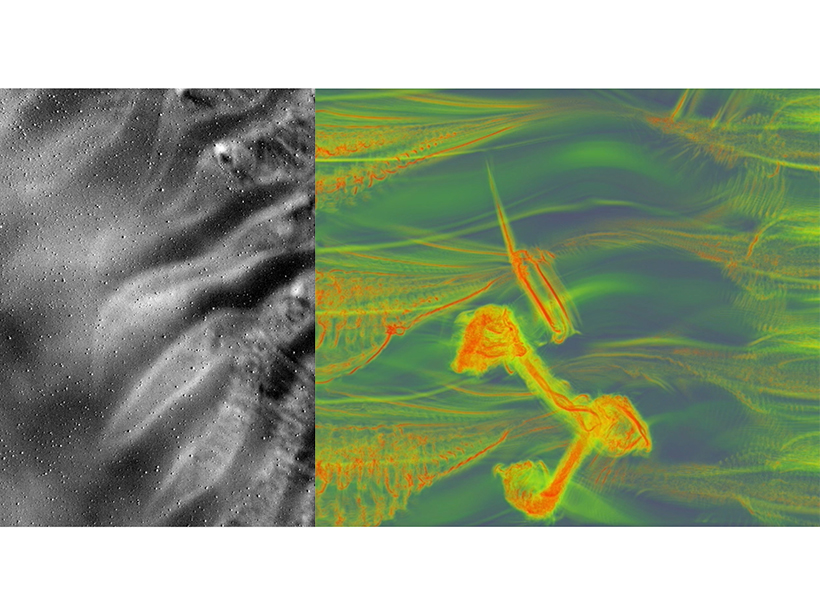
Newly Identified Instabilities Enhance Atmospheric Turbulence
New high-resolution imaging and modeling reveal the first evidence of enhanced turbulence due to gravity wave modulation of Kelvin-Helmholtz instabilities.
Posted inResearch Spotlights
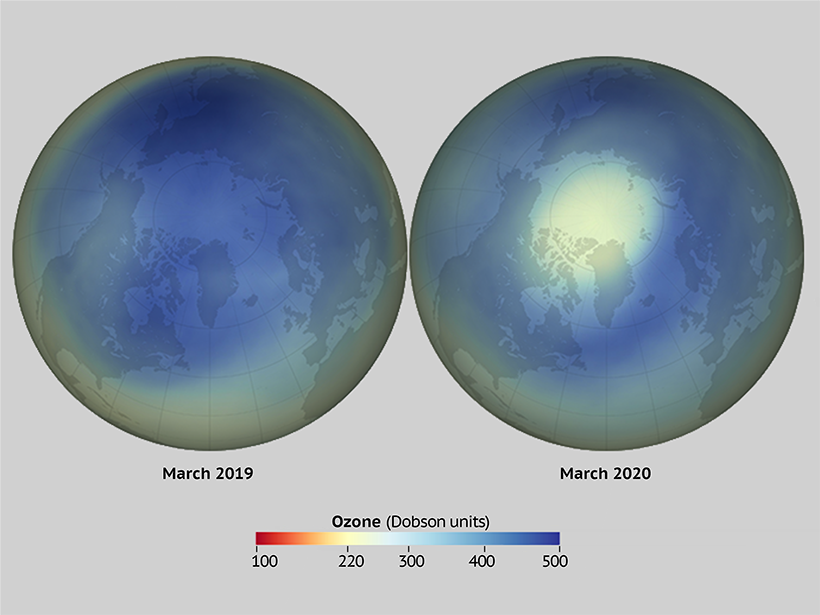
An Extraordinary Winter in the Polar North
An exceptionally strong stratospheric polar vortex coincided with a record-breaking Arctic Oscillation pattern and ozone destruction during the 2019–2020 winter season.

Posted inResearch Spotlights
Gravity Waves Leave Ripples Across a Glowing Night Sky
A thunderstorm made waves on a rare “bright night.”
Posted inEditors' Highlights
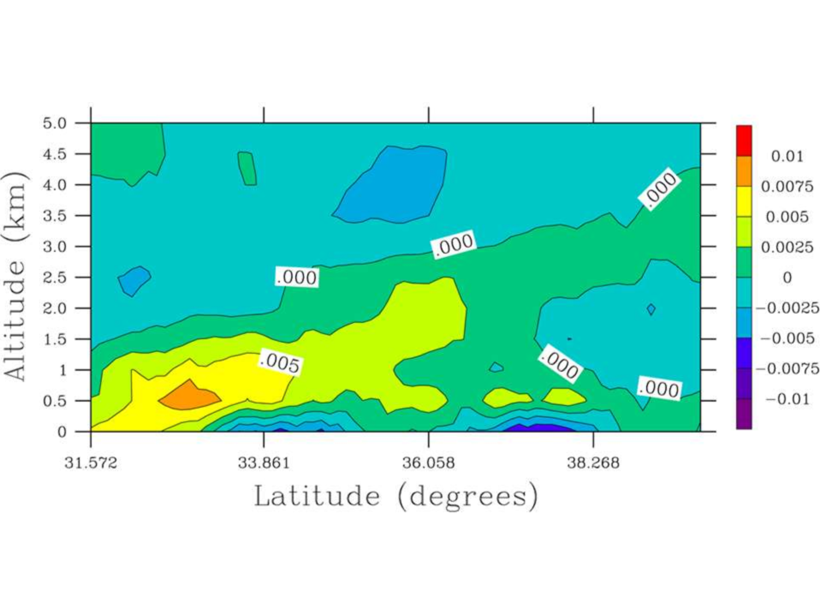
Comparing Impacts of CO2 and Particle Emission Reductions
Black carbon contained in airborne particles is often cited as a major factor warming the climate, but how much can California reduce climate change through reducing airborne particle concentrations?
Posted inEditors' Highlights
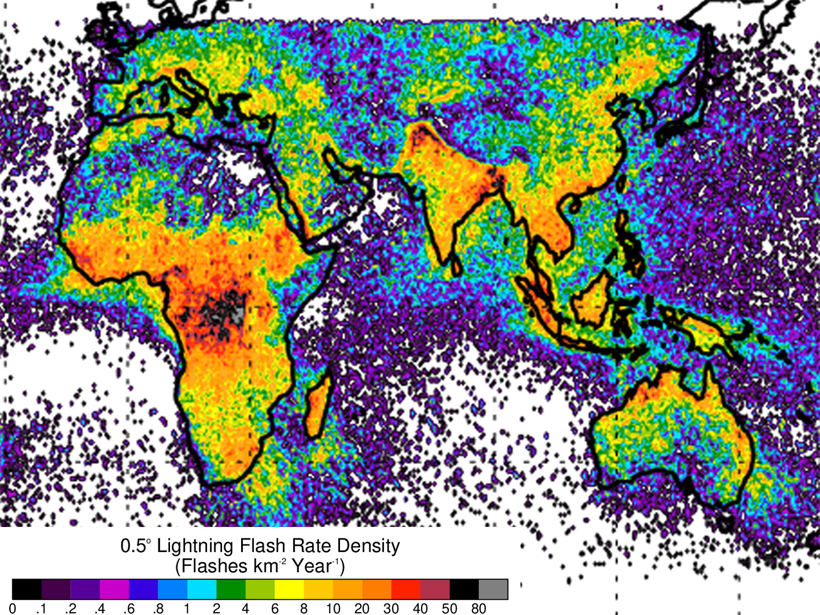
A New Look at Global Lightning from the Space Station
The Lightning Imaging Sensor on the International Space Station provides an expanded view of global lightning that improves scientific understanding of the Earth as well as public safety.
Posted inEditors' Highlights
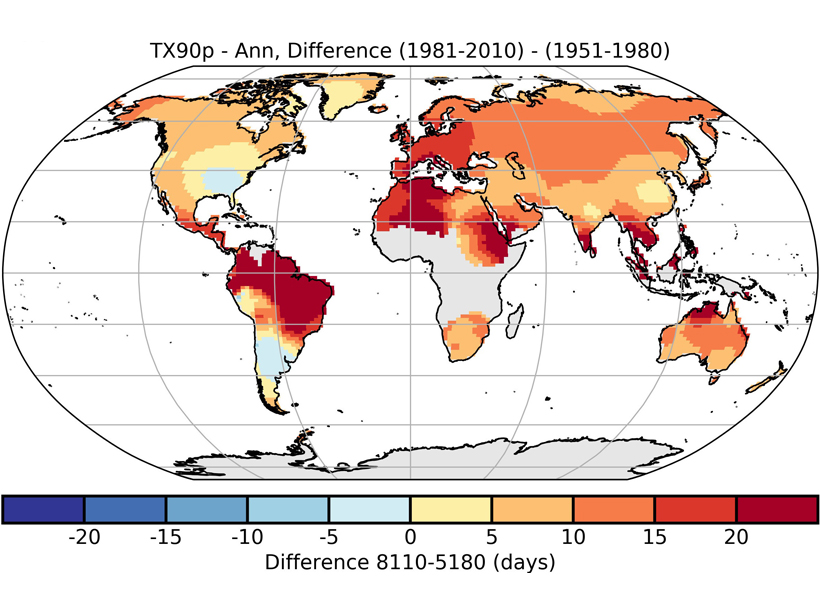
A New Dataset of Temperature and Precipitation Extremes
HadEX3 is an updated dataset of gridded temperature and precipitation extremes, that covers the period of 1901 to 2018 and has improved spatio-temporal coverage.

Posted inEditors' Highlights
Streamer Corona Discharges in Thunderstorms Detected from Space
Concurrent detection from space and the ground of blue optical flashes from streamer corona discharges at altitudes between 8.5 and 14 kilometers and radio waves.